Gold (XAUUSD) | Published by Chartrick’s Team of Experienced Technical Analysts
Weekly Analysis
April 20 – 24, 2026
4,829.31 (as on 18 Apr 2026)
Recovery Phase – Approaching Fibonacci 0.50 Critical Zone
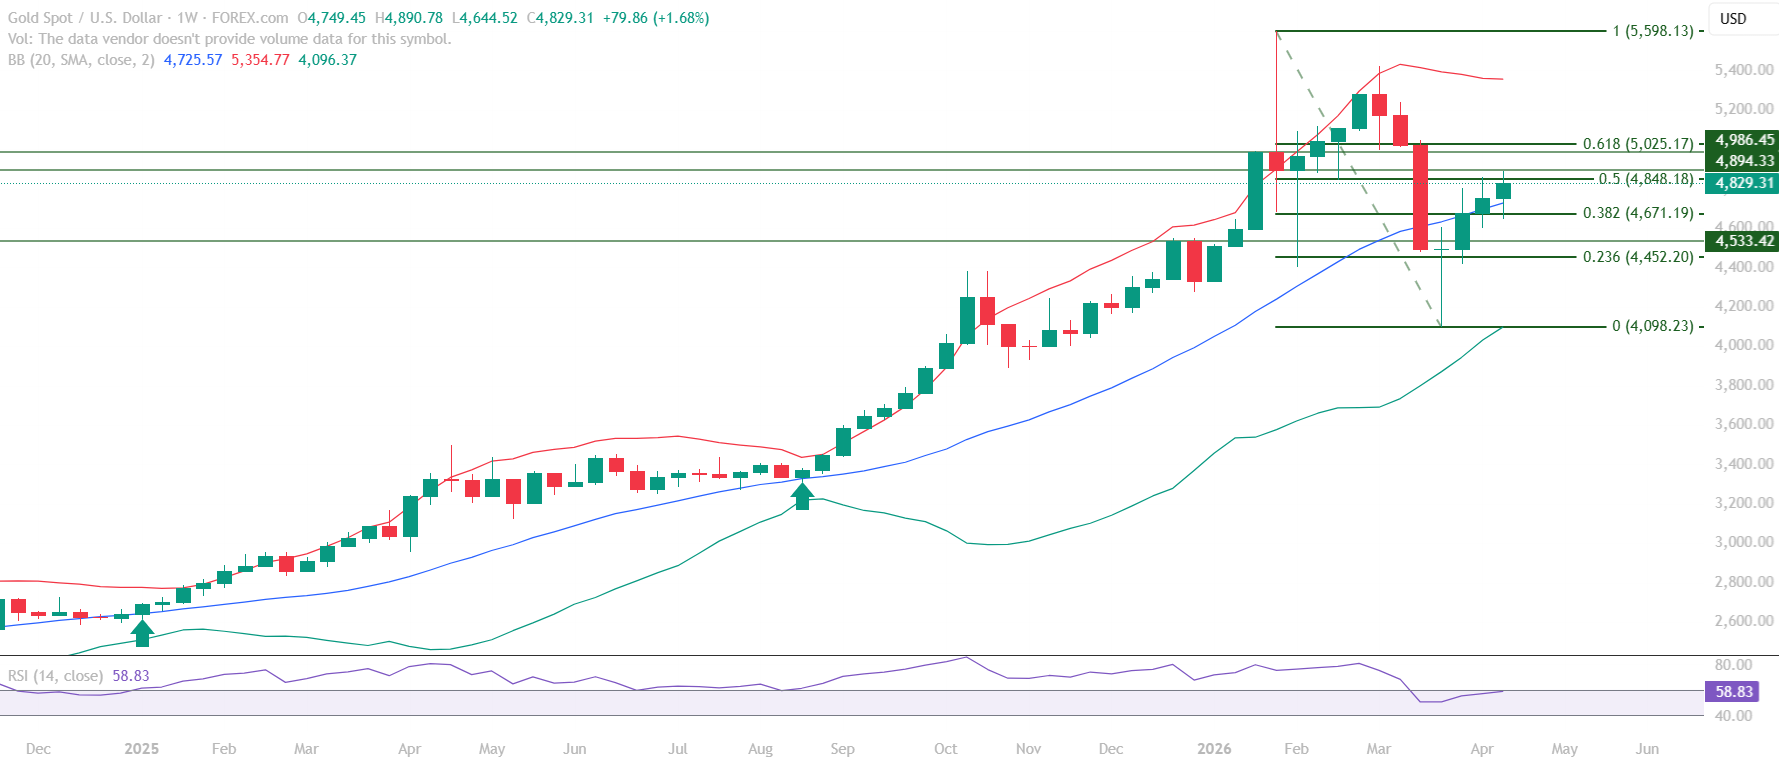
Gold (XAUUSD) weekly educational technical chart analysis for the week of April 20-24, 2026 identifies a market approaching a defining decision zone. Price has recovered from the 4,098.23 base, working progressively through the Fibonacci retracement framework to position itself just below the Fibonacci 0.50 resistance at 4,848.18 – the most significant resistance level in the current structure.
This Gold chart analysis examines the week’s positioning in detail: RSI at 58.83, price trading above both the Fibonacci 0.382 at 4,671.19 and the Mid Bollinger Band at 4,725.57, with the 4,848.18 to 4,894.33 zone representing the critical test ahead. The technical evidence points to a market with strengthening momentum that now faces its most consequential resistance test of the recovery phase.
All content on this page is educational technical chart analysis provided for informational purposes only. It does not constitute investment advice or any recommendation to buy, sell, or hold any financial instrument.
What Is the Current Structure in the Gold Chart?
The Gold (XAUUSD) chart structure for the week of April 20-24 is defined by a recovery phase from the corrective low at 4,098.23. The Fibonacci retracement framework traces the recovery: the 0.236 at 4,452.20 and the 0.382 at 4,671.19 have been cleared and confirmed as support levels, with price now trading above both and approaching the 0.50 retracement at 4,848.18.
The OHLC data for the period shows: Open 4,749.45 / High 4,890.78 / Low 4,644.52 / Close 4,829.31. The session high of 4,890.78 briefly tested above the 4,848.18 resistance level, while the close at 4,829.31 settled just below it – a technically significant interaction that defines the week’s key structural story.
- Fibonacci 0.382 at 4,671.19 – confirmed support, price trading above
- Mid Bollinger Band at 4,725.57 – confirmed support below current price
- Session high of 4,890.78 briefly tested above the Fibonacci 0.50 resistance
- Close at 4,829.31 settled below the 0.50 level – resistance not yet confirmed broken
- RSI at 58.83 – approaching the 60 level, key momentum threshold ahead
The Critical Zone: 4,848.18 to 4,894.33
This Gold educational technical chart analysis identifies the 4,848.18 to 4,894.33 zone as the critical decision area for the week ahead. The Fibonacci 0.50 at 4,848.18 is a structurally significant resistance level – the 50% retracement point typically represents a balanced midpoint where directional conviction is tested. A confirmed close above this level would be a meaningful structural development, while a rejection from it would define the near-term ceiling of the recovery phase.
The 4,894.33 level adds a second resistance reference to this zone, compressing the decision area into a tight range. The interaction between price and this dual zone will provide the primary technical read for the week.
What Are the RSI and Bollinger Band Signals Showing?
RSI at 58.83 places Gold just below the 60 level – a momentum threshold that in the context of this recovery phase represents the boundary between a corrective bounce and a momentum-confirmed advance. The RSI has been building progressively from the 40 level, which held as a floor on multiple pullbacks during the recovery structure. This progression from 40 toward 60 describes improving but not yet fully confirmed momentum.
The Mid Bollinger Band at 4,725.57 is confirmed as support, with price trading above it going into the week. This positioning acts as a dynamic support reference on any pullback toward that level during the week. Price acceptance above the Mid Bollinger Band is a Bollinger Band signal consistent with a market in a recovery phase.
- RSI 58.83 – approaching the 60 momentum threshold, not yet crossed
- RSI 40 held as floor throughout recovery phase – structural momentum support confirmed
- Mid Bollinger Band at 4,725.57 confirmed as support below price
- Upper Bollinger Band defines the extended resistance zone above the Fibonacci levels
Key Technical Levels for Gold (XAUUSD)
The following levels are identified in this Gold educational technical chart analysis. All levels are derived from Vipul’s expert chart analysis using publicly available market data.
Resistance Levels
| Resistance Type | Price Level | Notes |
|---|---|---|
| Critical Resistance Zone | 4,848.18 – 4,894.33 | Fibonacci 0.50 + key structural resistance – defining decision zone for the week |
| Major Resistance | 5,025.17 | Fibonacci 0.618 – next significant level above if critical zone is cleared |
Support Levels
| Support Type | Price Level | Notes |
|---|---|---|
| Immediate Support | 4,725.57 | Mid Bollinger Band – dynamic support confirmed below current price |
| Key Structural Support | 4,671.19 | Fibonacci 0.382 – major structural support, confirmed during recovery |
| Strong Support | 4,452.20 | Fibonacci 0.236 retracement |
| Major Support | 4,098.23 | Fibonacci 0 – corrective phase base level |
Summary: Gold Technical Outlook for the Week
This Gold (XAUUSD) weekly educational technical chart analysis identifies a market at a genuine structural inflection point. The recovery from 4,098.23 has been methodical and technically sound – support levels confirmed through the Fibonacci framework, RSI building progressively, and the Mid Bollinger Band converted from resistance to support. The market arrives at the Fibonacci 0.50 zone with improving but not yet confirmed momentum.
The week’s outcome at the 4,848.18 to 4,894.33 zone will provide the primary technical read for Gold’s next directional phase. A confirmed hold above 4,848.18 on a weekly close would represent a meaningful structural development for the medium-term chart structure. A rejection and reversion toward the 4,671.19 to 4,725.57 support zone would confirm the Fibonacci 0.50 as continued resistance within the broader recovery.
- Gold at a critical Fibonacci 0.50 decision zone at 4,848.18
- RSI at 58.83 approaching the 60 momentum threshold – not yet crossed
- Session high of 4,890.78 tested above resistance – close at 4,829.31 below it
- Fibonacci 0.382 at 4,671.19 confirmed as structural support
- Mid Bollinger Band at 4,725.57 acting as dynamic support below price
Want Expert Analysis on a Specific Asset?
Request a custom weekly chart interpretation of Equities, Cryptos, Commodities & Indices from Chartrick’s team of experienced technical analysts. Delivered to your inbox within 2 working days.
Decoding the Language of Charts.
Important Disclaimer
All content on Chartrick, including charts, analysis reports, articles, and educational materials, is provided for general informational and educational purposes only. Nothing on this platform constitutes investment advice, financial advice, trading advice, or any recommendation to buy, sell, or hold any financial instrument. Financial markets carry risk, and past chart analysis does not guarantee future performance. All analysis is based on publicly available market data and is subject to change at any time. While every effort is made to ensure accuracy, Chartrick does not accept liability for any loss, damage, or financial outcome arising directly or indirectly from use of or reliance on this content, including any errors or omissions in the analysis. Users are solely responsible for their own investment and trading decisions and should exercise their own independent judgment.