Silver (XAGUSD) | Published by Chartrick’s Team of Experienced Technical Analysts
Daily Analysis
April 14, 2026 – Monday
75.535 (as on 11 Apr 2026)
Stabilizing / Early Recovery – RSI Building from Support Floor
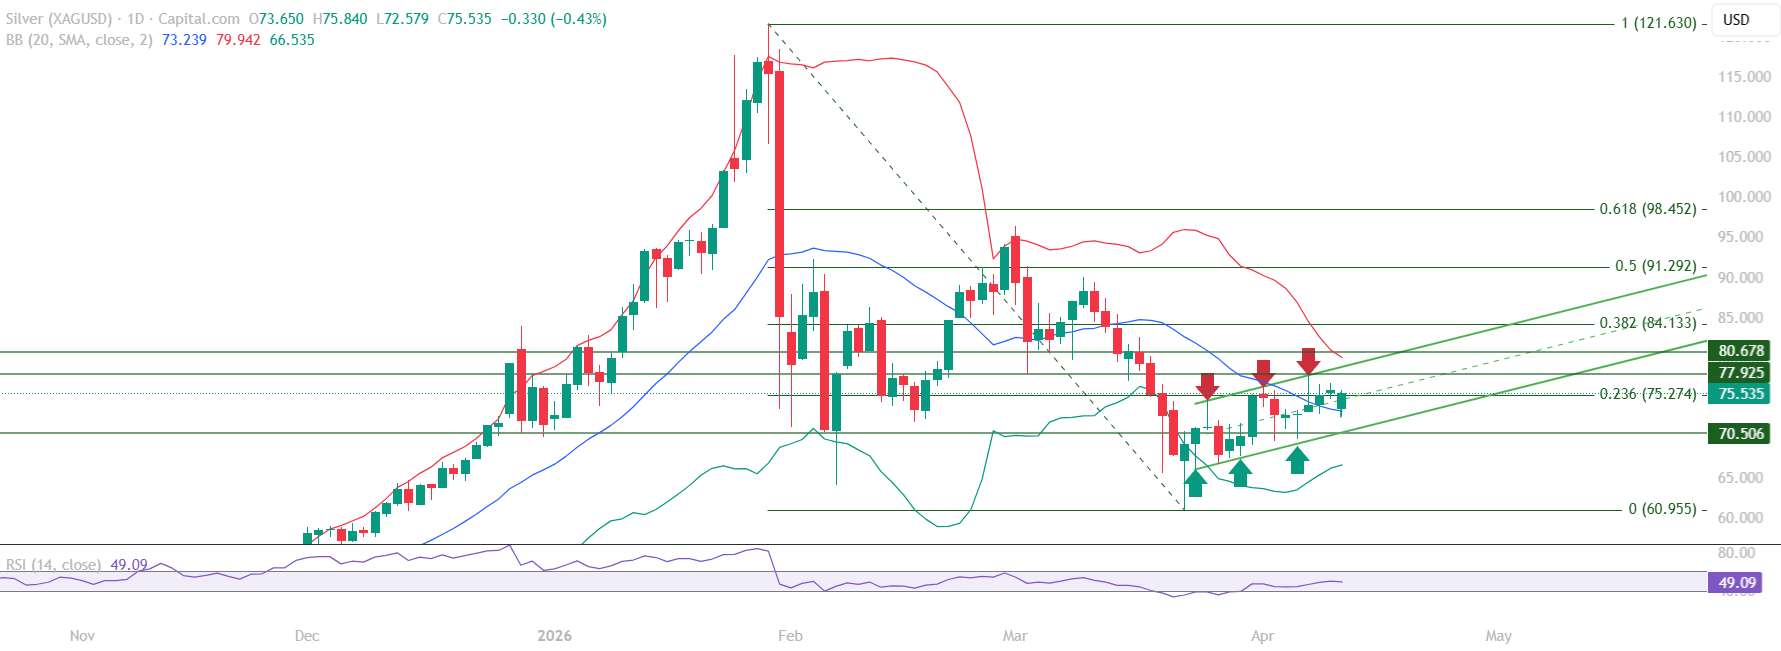
Silver (XAGUSD) educational technical chart analysis for April 14, 2026 identifies a market in the early stages of a stabilization phase, with price consolidating near the Fibonacci 0.236 level at 75.274 and RSI at 49.09. This reading sits at the midpoint of the momentum scale – a balanced signal that describes neither a momentum-confirmed advance nor a deteriorating structure, but a market building the conditions required for the next directional move.
This Silver chart analysis examines the defining structural development of this phase: the 70.506 level has transitioned from a resistance zone that capped prior recovery attempts to a support level that has been held through multiple retests. This resistance-to-support transition is the most significant chart event in the current Silver structure, and the continued defence of this level defines the floor of the stabilization phase.
All content on this page is educational technical chart analysis provided for informational purposes only. It does not constitute investment advice or any recommendation to buy, sell, or hold any financial instrument.
What Is the Structural Significance of the 70.506 Level?
In this Silver educational technical chart analysis, the 70.506 level represents a textbook polarity change – a price zone where the market’s structural behaviour has reversed. A level that previously acted as resistance, capping multiple recovery attempts, has now been cleared and is holding as support on retests. This type of structural transition carries technical weight because it reflects a genuine shift in how the market is behaving at that price zone.
The robustness of 70.506 as support is important context for the current chart structure. A level that holds on a single test carries less structural significance than one that absorbs multiple retests and holds each time. This Silver chart analysis shows the 70.506 level has been retested and defended consistently, adding credibility to its role as the structural floor for the current stabilization phase.
- 70.506 – former resistance zone, now confirmed structural support through multiple retests
- Polarity change confirmed – market behaviour has genuinely shifted at this level
- Multiple retests held – structural significance strengthened with each successful defence
- Mid Bollinger Band at 73.239 – immediate support between 70.506 and current price
- Fibonacci 0.236 at 75.274 – immediate overhead resistance just above current price
How Is RSI Reading the Momentum at This Stage?
RSI at 49.09 in this Silver educational technical chart analysis is a technically neutral reading. The 49-50 zone sits at the exact midpoint of the RSI scale, and the direction from which it arrives at this level provides the meaningful context. RSI has been building progressively from the 40 level – which has served as the structural momentum floor through the stabilization phase – toward the 50 midpoint, and the direction of that build describes early constructive momentum, even while the current reading remains neutral.
The two RSI reference levels to track in this Silver analysis are: the 40 level as the structural support that has been held through the stabilization phase, and the 60 level as the momentum confirmation threshold above which a more sustained advance would be technically described. RSI at 49.09 is positioned between these two references – above the floor, not yet at confirmation.
- RSI 49.09 – at the momentum midpoint scale, neutral reading
- RSI building from the 40 floor toward the midpoint – direction is constructive
- RSI 40 has held as the structural momentum floor throughout this phase
- RSI 60 is the confirmation threshold – the next key level to watch
- Momentum pattern consistent with early stabilization ahead of a potential recovery phase
Bollinger Band Structure
The Mid Bollinger Band at 73.239 is positioned between the 70.506 structural support and the current price level of 75.535, acting as an immediate support reference for any intraday or short-term pullback within the stabilization phase. Price trading above the Mid Bollinger Band is a Bollinger Band condition consistent with a market in a stabilization or early recovery structure. The Fibonacci 0.236 at 75.274 sits just below the current price level, and the close above it contributes to the early constructive reading in this analysis.
Key Technical Levels for Silver (XAGUSD)
The following levels are identified in this Silver educational technical chart analysis. All levels are derived from Vipul’s expert chart analysis using publicly available market data.
Resistance Levels
| Resistance Type | Price Level | Notes |
|---|---|---|
| Immediate Resistance | 75.274 | Fibonacci 0.236 – immediate overhead resistance, price testing this zone |
| Strong Resistance | 84.133 | Fibonacci 0.382 retracement – next significant level above |
| Key Resistance | 91.292 | Fibonacci 0.50 retracement |
| Major Resistance | 98.452 | Fibonacci 0.618 retracement |
Support Levels
| Support Type | Price Level | Notes |
|---|---|---|
| Immediate Support | 73.239 | Mid Bollinger Band – dynamic support between structural floor and price |
| Key Support | 70.506 | Former resistance, confirmed structural support – multiple retests held |
| Major Support | 60.955 | Fibonacci 0 – corrective phase base, major structural floor |
Summary: Silver Technical Outlook
This Silver (XAGUSD) educational technical chart analysis for April 14, 2026 identifies a market in early stabilization with the structural foundation at 70.506 firmly defended and RSI building from the 40 floor toward a more momentum-confirmed position. Price is consolidating near the Fibonacci 0.236 at 75.274, with the Mid Bollinger Band at 73.239 providing immediate support below.
The chart structure at this point describes a market that has established a structural floor through the resistance-to-support transition at 70.506 and is now building the momentum conditions for a potential advance. The RSI progression from 40 toward the 60 level, and price’s relationship with the Fibonacci 0.236, will be the key indicators to track as the stabilization phase develops.
- Silver stabilizing above the 70.506 structural support floor – multiple retests held
- Resistance-to-support transition at 70.506 confirmed, structural credibility established
- RSI at 49.09 – neutral reading, building constructively from the 40 floor
- Mid Bollinger Band at 73.239 acting as immediate support reference
- Fibonacci 0.236 at 75.274 is the immediate resistance to watch for momentum confirmation
Want Expert Analysis on a Specific Asset?
Request a custom weekly chart interpretation of Equities, Cryptos, Commodities & Indices from Chartrick’s team of experienced technical analysts. Delivered to your inbox within 2 working days.
Decoding the Language of Charts.
Important Disclaimer
All content on Chartrick, including charts, analysis reports, articles, and educational materials, is provided for general informational and educational purposes only. Nothing on this platform constitutes investment advice, financial advice, trading advice, or any recommendation to buy, sell, or hold any financial instrument. Financial markets carry risk, and past chart analysis does not guarantee future performance. All analysis is based on publicly available market data and is subject to change at any time. While every effort is made to ensure accuracy, Chartrick does not accept liability for any loss, damage, or financial outcome arising directly or indirectly from use of or reliance on this content, including any errors or omissions in the analysis. Users are solely responsible for their own investment and trading decisions and should exercise their own independent judgment.