Bitcoin (BTC) | Published by Chartrick’s Team of Experienced Technical Analysts
Daily Analysis
April 13, 2026 – Sunday
70,746 (as on 12 Apr 2026)
Consolidation within Broader Corrective Structure – Trendline Rejection
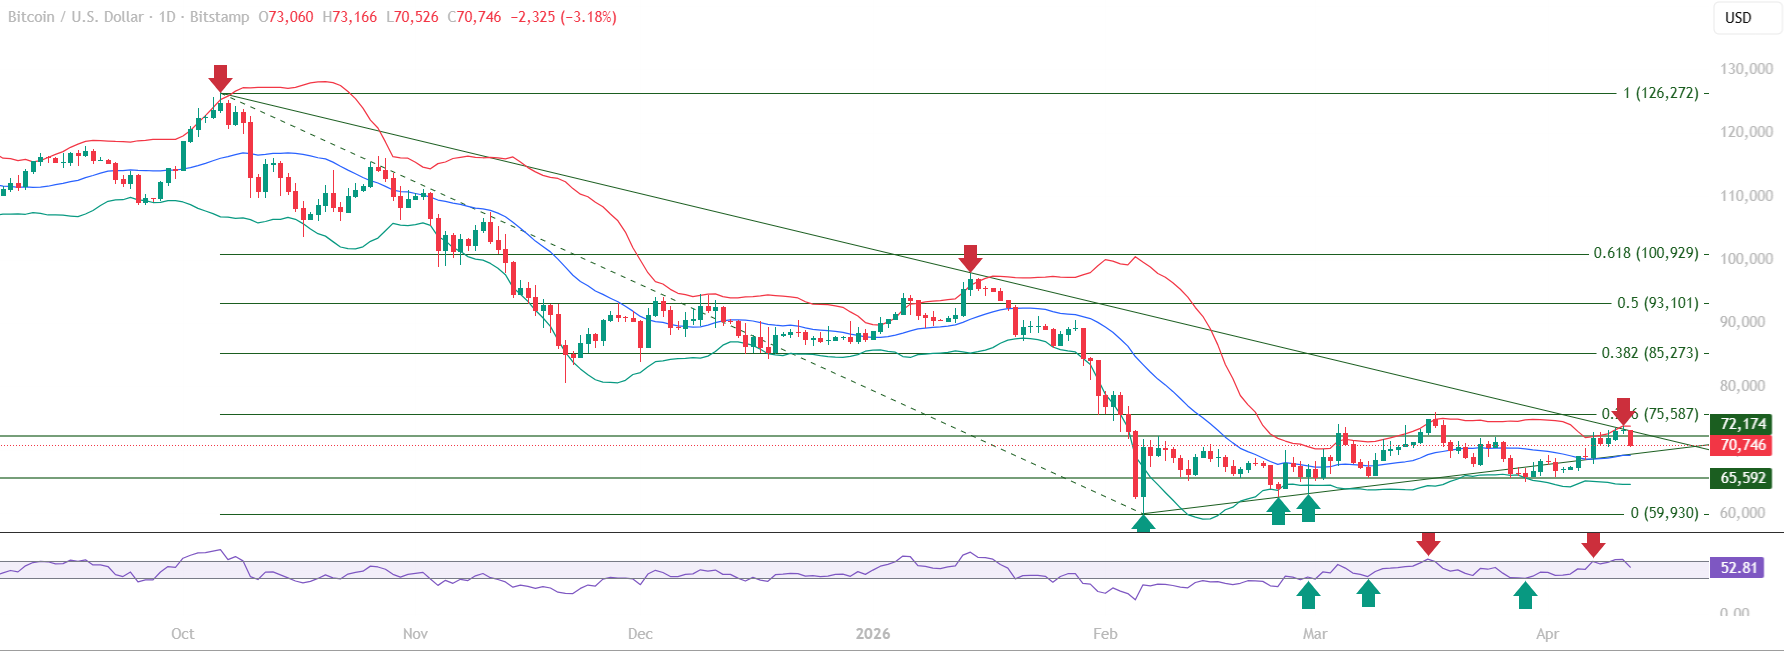
Bitcoin (BTC) educational technical chart analysis for April 13, 2026 captures a technically significant price event: price opened at 73,060, advanced to a session high of 73,166 where it tested the downward sloping trendline, and reversed sharply to close at 70,746 – a decline of 3.18% from the open. This trendline rejection is the defining chart event for the session and the primary structural story in today’s Bitcoin analysis.
This Bitcoin chart analysis places the April 13 price action in its full structural context. The downward sloping trendline, formed during the broader corrective phase from prior highs, continues to act as the primary overhead resistance. The session tested and respected this trendline precisely, producing a textbook rejection that reinforces the trendline’s structural relevance and confirms the consolidation range boundaries.
All content on this page is educational technical chart analysis provided for informational purposes only. It does not constitute investment advice or any recommendation to buy, sell, or hold any financial instrument.
What Makes This Trendline Rejection Structurally Significant?
In this Bitcoin educational technical chart analysis, the precision of the April 13 rejection adds structural significance beyond a routine intraday reversal. Price advanced from the open at 73,060 to a session high of 73,166 – a narrow range that aligns closely with the downward sloping trendline’s position on that date – before reversing to close 3.18% lower. The size of the reversal from a specific, well-defined technical level is the signal this chart analysis identifies as structurally meaningful.
The downward sloping trendline in this Bitcoin chart analysis connects the highs of the broader corrective phase. Each documented rejection from this trendline adds to its structural credibility as an active resistance boundary. The April 13 rejection is one instance in a pattern of trendline respects – the market continuing to treat this technical level as a structural ceiling within the consolidation range.
- Session open at 73,060 – high of 73,166, precisely at the downward sloping trendline
- Close at 70,746 – 3.18% decline from open, a material reversal from trendline contact
- Downward sloping trendline has produced multiple documented rejections – structural credibility confirmed
- Fibonacci 0.236 at 75,587 aligns near the trendline zone – dual confluence resistance overhead
- Upward sloping trendline below price continues to act as structural floor support
What Is the Consolidation Range Structure Showing?
The consolidation range in this Bitcoin educational technical chart analysis is bounded by two structural references: the downward sloping trendline above (defining the ceiling) and the 59,930 structural base below (defining the floor). Within this range, the reclaimed upward sloping trendline provides a dynamic support floor, with price compressing between these structural references.
The base formation behaviour visible in this chart analysis is characterised by accumulation at lower levels and successive higher lows within the consolidation range. Price has not made a new cycle low since the 59,930 base was established, while each attempt to break above the downward sloping trendline has been rejected. This structure describes a market building compression ahead of an eventual resolution.
- Consolidation range: downward sloping trendline above, 59,930 structural base below
- Upward sloping trendline reclaimed and acting as dynamic support floor within the range
- No new cycle lows since 59,930 base established – accumulation behaviour confirmed
- Each trendline test rejected – ceiling remains structurally intact as of this session
- Compression between trendlines describes a market approaching a structural resolution
RSI and Momentum Context
RSI analysis in this Bitcoin chart analysis shows the momentum indicator near the 60 level at the time of the trendline test. RSI approaching the 60 threshold at the same time price tested the trendline is a notable technical alignment – a momentum reading at a key threshold meeting a price level at a key resistance. The rejection from the trendline occurred with RSI not yet confirming a sustained move above 60, consistent with the broader pattern of the 60 level acting as a momentum ceiling within the corrective structure.
The 40 level on RSI has held as the structural momentum floor throughout the base formation period. This dual-boundary momentum pattern – 40 as floor, 60 as ceiling – mirrors the dual-boundary price structure of the consolidation range and reinforces the assessment of a market in compression ahead of a structural resolution.
Key Technical Levels for Bitcoin (BTC)
The following levels are identified in this Bitcoin educational technical chart analysis. All levels are derived from Vipul’s expert chart analysis using publicly available market data.
Resistance Levels
| Resistance Type | Price Level | Notes |
|---|---|---|
| Trendline Resistance | ~73,166 zone | Downward sloping trendline – April 13 rejection zone, active structural ceiling |
| Major Resistance | 75,587 | Fibonacci 0.236 – key resistance above trendline, dual confluence zone |
Support Levels
| Support Type | Price Level | Notes |
|---|---|---|
| Immediate Support | 69,146 | Mid Bollinger Band – structural support reference below current price |
| Key Support | 65,592 | Broader structural support level within the consolidation base |
| Major Support | 59,930 | Fibonacci 0 – corrective phase base, consolidation floor |
Summary: Bitcoin Technical Outlook
This Bitcoin (BTC) educational technical chart analysis for April 13, 2026 identifies a market that produced a clean, technically precise trendline rejection. The session opened near the trendline, tested it at 73,166, and reversed to close at 70,746. This price action reinforces the downward sloping trendline as an active structural boundary within the consolidation range and confirms that the ceiling of the range remains intact.
The broader consolidation structure continues: the 59,930 base provides the floor, the downward sloping trendline provides the ceiling, and the upward sloping trendline below price provides dynamic support within the range. The structural question ahead is whether subsequent sessions retest the trendline zone or initiate a move toward the Mid Bollinger Band support at 69,146. Either development will provide the next read on the compression structure’s resolution timeline.
- April 13 trendline rejection: precise test at 73,166, close at 70,746, 3.18% reversal
- Downward sloping trendline remains active structural resistance ceiling
- Fibonacci 0.236 at 75,587 creates dual confluence resistance above the trendline
- Mid Bollinger Band at 69,146 is the immediate support to monitor post-rejection
- RSI near 60 at rejection – momentum ceiling aligning with price resistance ceiling
Want Expert Analysis on a Specific Asset?
Request a custom weekly chart interpretation of Equities, Cryptos, Commodities & Indices from Chartrick’s team of experienced technical analysts. Delivered to your inbox within 2 working days.
Decoding the Language of Charts.
Important Disclaimer
All content on Chartrick, including charts, analysis reports, articles, and educational materials, is provided for general informational and educational purposes only. Nothing on this platform constitutes investment advice, financial advice, trading advice, or any recommendation to buy, sell, or hold any financial instrument. Financial markets carry risk, and past chart analysis does not guarantee future performance. All analysis is based on publicly available market data and is subject to change at any time. While every effort is made to ensure accuracy, Chartrick does not accept liability for any loss, damage, or financial outcome arising directly or indirectly from use of or reliance on this content, including any errors or omissions in the analysis. Users are solely responsible for their own investment and trading decisions and should exercise their own independent judgment.