S&P 500 (SPX) | Published by Chartrick’s Team of Experienced Technical Analysts
Daily Analysis
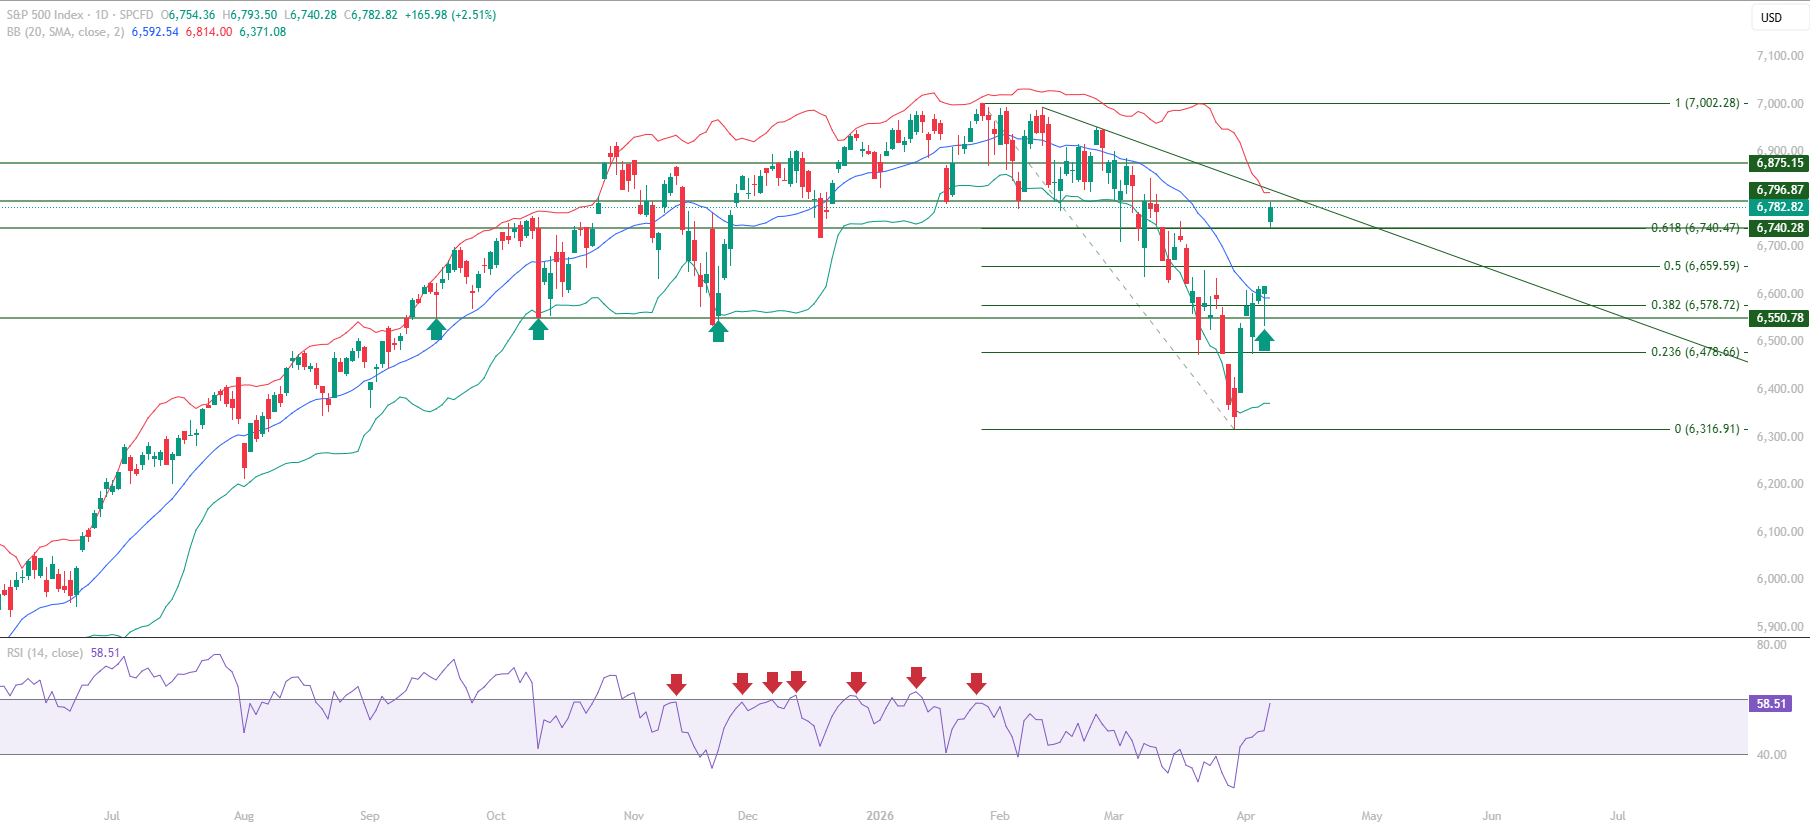
S&P 500 educational technical chart analysis for April 9, 2026 identifies a powerful structural development: price has pushed decisively through the Fibonacci 0.618 retracement at 6,740.47, closing at 6,782.82 and reclaiming every major Fibonacci level from the recent decline. RSI is approaching the 60 level, and the downward sloping trendline from the decline highs now converges near the 6,796.87 immediate resistance – the structural test that will define the next phase.
This S&P 500 chart analysis traces the recovery: from the 6,316.91 base, through the 0.236 at 6,478.66, the 0.382 at 6,578.72, the 0.50 at 6,659.59, and now the 0.618 at 6,740.47 cleared in succession. The breadth of this Fibonacci reclaim describes a market with genuine recovery momentum, not a fragmented bounce.
All content on this page is educational technical chart analysis provided for informational purposes only. It does not constitute investment advice or any recommendation to buy, sell, or hold any financial instrument.
What Makes the Fibonacci 0.618 Reclaim Structurally Significant?
In this S&P 500 educational technical chart analysis, the 0.618 reclaim at 6,740.47 is a meaningful structural milestone. Clearing this level indicates the index has recovered the majority of the prior decline and is approaching the zone where the broader uptrend framework reasserts itself. The successive reclaim of 0.236, 0.382, 0.50, and 0.618 in an organised, directional move describes accumulation at lower levels transitioning into directional momentum.
Signs of a higher high / higher low formation are visible in the recovery structure. The Mid Bollinger Band at 6,592.54 has been left well below current price, now acting as a strong support zone. This distance between price and the Mid Bollinger Band is a characteristic of a market in a momentum-backed advance rather than a fragile corrective bounce.
- Fibonacci 0.618 at 6,740.47 – cleared, now transitioning to structural support
- Recovery from 6,316.91 through all four Fibonacci levels – organised, directional advance
- Higher high / higher low formation visible in the recovery structure
- Mid Bollinger Band at 6,592.54 now acting as strong support well below price
- Downward sloping trendline from decline highs converging near 6,796.87 – next test
What Does the Trendline Confluence at 6,796.87 Represent?
The downward sloping trendline from the decline highs sits at the same zone as the 6,796.87 immediate resistance in this S&P 500 chart analysis. This creates a confluence of two independent technical signals at the same price level: a resistance level and a structural trendline ceiling. The interaction between price and this dual confluence will be the primary technical event following the 0.618 reclaim.
A sustained close above the trendline would remove the structural ceiling of the corrective phase entirely and represent a meaningful upgrade to the chart structure. RSI approaching the 60 level simultaneously describes improving momentum that, if confirmed above 60, would provide the momentum signal consistent with trend resumption.
- Trendline from decline highs converges at 6,796.87 immediate resistance – dual confluence
- Sustained break above trendline would remove corrective phase ceiling
- RSI approaching 60 – momentum threshold for trend resumption vs corrective bounce
- 6,875.15 is the next major resistance above the trendline confluence zone
- 40 level held as RSI floor through the entire recovery – momentum base confirmed
Bollinger Band and Fibonacci Framework
The Fibonacci framework in this S&P 500 educational technical chart analysis spans from 6,316.91 (the corrective low) to recent highs. With the 0.618 at 6,740.47 now cleared, this level shifts from resistance to support. The 0.50 at 6,659.59 provides major support below, and the Mid Bollinger Band at 6,592.54 adds a third support reference. Price sustaining above the Mid Bollinger Band is a Bollinger Band signal consistent with a momentum-backed advance.
Key Technical Levels for S&P 500 (SPX)
The following levels are identified in this S&P 500 educational technical chart analysis. All levels are derived from Vipul’s expert chart analysis using publicly available market data.
Resistance Levels
| Resistance Type | Price Level | Notes |
|---|---|---|
| Trendline Confluence Resistance | 6,796.87 | Downward sloping trendline + immediate resistance – primary test zone |
| Major Resistance | 6,875.15 | Next significant overhead resistance above the trendline zone |
Support Levels
| Support Type | Price Level | Notes |
|---|---|---|
| Immediate Support | 6,740.47 | Fibonacci 0.618 – cleared, now acting as structural support |
| Major Support | 6,659.59 | Fibonacci 0.50 – major structural support |
| Key Support | 6,592.54 | Mid Bollinger Band – strong support well below current price |
| Structural Base | 6,316.91 | Fibonacci 0 – corrective phase low, base of recovery |
Summary: S&P 500 Technical Outlook
This S&P 500 educational technical chart analysis for April 9, 2026 identifies a market executing a broad, organised Fibonacci reclaim with the 0.618 now cleared. The recovery from 6,316.91 has been structurally sound – each Fibonacci level reclaimed and converted to support, RSI building from the 40 floor toward the 60 threshold, and the Mid Bollinger Band comfortably below price.
The trendline confluence at 6,796.87 is the structural event to monitor in the sessions ahead. The broader uptrend on the long-term timeframe remains intact. Any pullback from current levels would represent a test of the Fibonacci and Bollinger Band support structure established during the recovery, not a breakdown of the broader trend.
- Fibonacci 0.618 at 6,740.47 cleared – structural milestone for the recovery
- Successive Fibonacci reclaim from 6,316.91 describes momentum-backed advance
- RSI approaching 60 – momentum threshold for trend resumption signal
- Trendline confluence at 6,796.87 is the primary near-term structural test
- Mid Bollinger Band at 6,592.54 provides strong support well below current price
Want Expert Analysis on a Specific Asset?
Request a custom weekly chart interpretation of Equities, Cryptos, Commodities & Indices from Chartrick’s team of experienced technical analysts. Delivered to your inbox within 2 working days.
Decoding the Language of Charts.
Important Disclaimer
All content on Chartrick, including charts, analysis reports, articles, and educational materials, is provided for general informational and educational purposes only. Nothing on this platform constitutes investment advice, financial advice, trading advice, or any recommendation to buy, sell, or hold any financial instrument. Financial markets carry risk, and past chart analysis does not guarantee future performance. All analysis is based on publicly available market data and is subject to change at any time. While every effort is made to ensure accuracy, Chartrick does not accept liability for any loss, damage, or financial outcome arising directly or indirectly from use of or reliance on this content, including any errors or omissions in the analysis. Users are solely responsible for their own investment and trading decisions and should exercise their own independent judgment.