Gold (XAUUSD) | Published by Chartrick’s Team of Experienced Technical Analysts
Daily Analysis
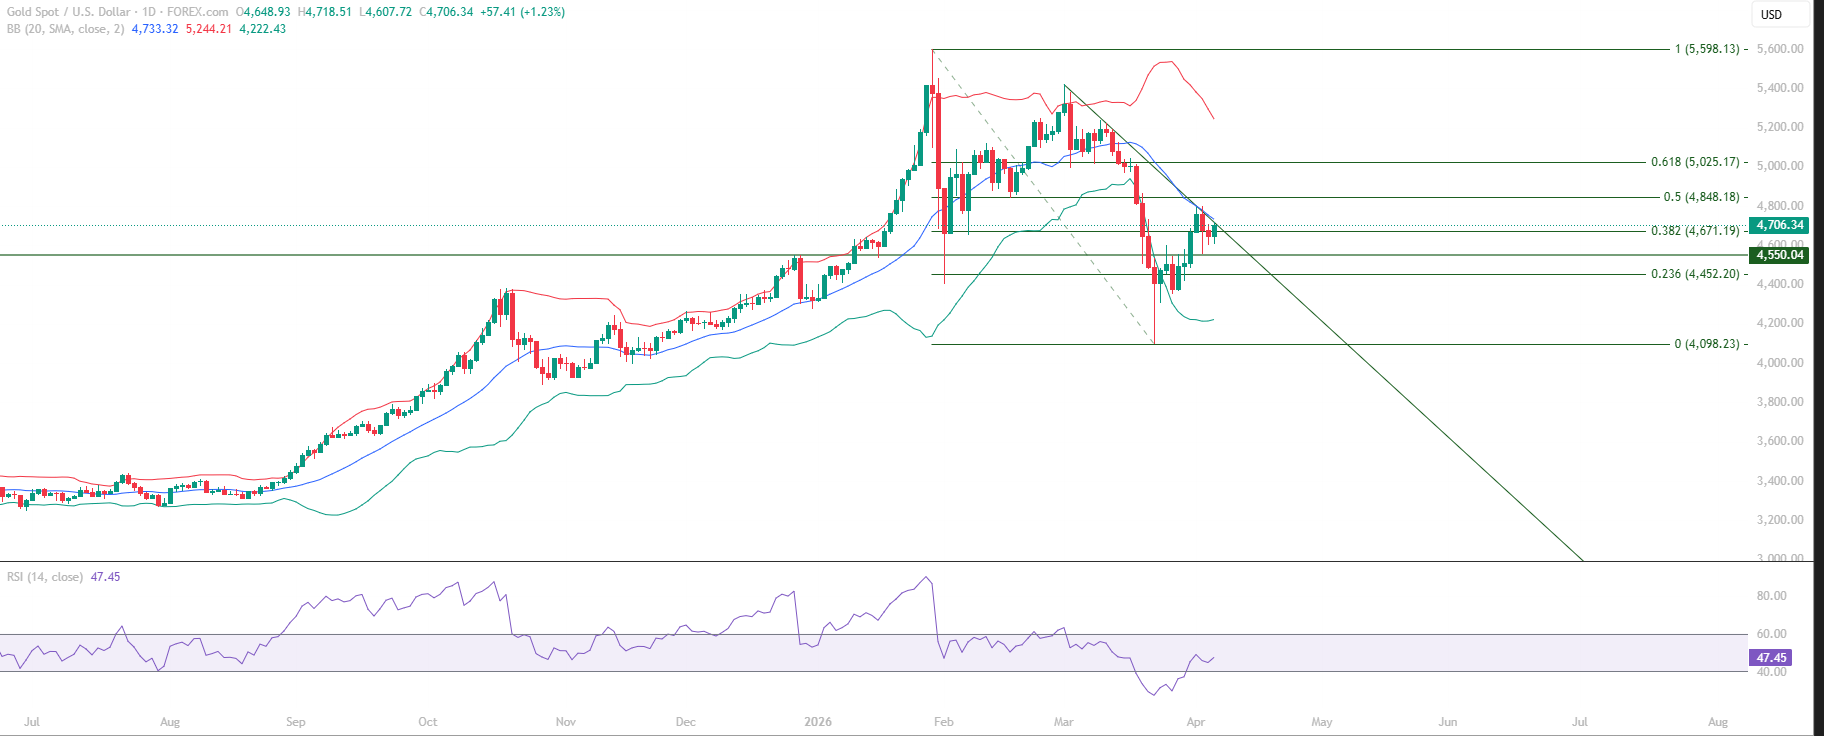
Gold (XAUUSD) educational technical chart analysis for April 8, 2026 identifies a sharp recovery structure following a decisive retest of the 4,550 support level. Price has rallied from the retest and closed above the Fibonacci 0.382 at 4,671.19, with CMP at 4,706.34 now approaching the Mid Bollinger Band at 4,733.32 – a level that sits at the convergence of the Mid Bollinger Band and the downward sloping trendline, creating a dual confluence resistance zone that defines the near-term structural test.
This Gold chart analysis examines the significance of the 4,550 level holding and the quality of the recovery advance. The Fibonacci 0.382 at 4,671.19 has been cleared and is now acting as support below price. RSI sustaining above the 40 level throughout this recovery describes improving momentum retention. The interaction between price and the 4,733.32 dual confluence resistance will determine whether the recovery phase extends further toward the Fibonacci 0.50 at 4,848.18.
All content on this page is educational technical chart analysis provided for informational purposes only. It does not constitute investment advice or any recommendation to buy, sell, or hold any financial instrument.
Why Is the 4,550 Retest Structurally Significant?
In this Gold educational technical chart analysis, the 4,550 level has established itself as a reliable structural reference through repeated testing and defending. Each retest that holds adds to the structural credibility of this level as a meaningful support zone. The retest on April 8 produced a sharp recovery response, which is the type of clean structural signal this chart analysis identifies as technically significant.
The quality of the recovery from 4,550 is also worth noting. Price has not only bounced – it has cleared the Fibonacci 0.382 at 4,671.19 and continued advancing toward the 4,733.32 resistance zone. This advance of 155+ points from the 4,550 retest describes a market with buying conviction at that structural level, not a weak corrective bounce.
- 4,550 level – retested and held decisively, confirming as major structural support
- Fibonacci 0.382 at 4,671.19 – cleared during advance, now acting as structural support
- Recovery advance of 155+ points from 4,550 retest – describes genuine buying conviction
- RSI sustaining above 40 throughout recovery – momentum floor confirmed
- 4,733.32 to 4,848.18 is the resistance zone ahead of the advance
What Is the Dual Confluence Resistance at 4,733.32?
The Mid Bollinger Band at 4,733.32 in this Gold chart analysis is the first significant resistance above current price. What makes this level particularly notable is the downward sloping trendline converging at the same zone – creating a dual confluence of independent technical signals at the same price area. The Mid Bollinger Band provides a dynamic resistance reference; the downward sloping trendline provides a structural boundary from the corrective phase.
A sustained close above both the Mid Bollinger Band and the trendline would represent a meaningful structural development for the recovery phase. It would describe a market that has not only recovered from the 4,550 structural test but has cleared the dynamic and structural overhead resistance simultaneously. A rejection from the confluence would maintain the current recovery structure boundaries.
- Mid Bollinger Band at 4,733.32 – dynamic resistance, first overhead test for recovery
- Downward sloping trendline aligns at the same zone – dual confluence resistance
- A sustained break above both signals would be a meaningful structural development
- Fibonacci 0.50 at 4,848.18 is the next major resistance above the confluence
- RSI 40 as momentum floor – breakdown below this level would weaken the structure
Fibonacci Reference Framework
The Fibonacci structure in this Gold educational technical chart analysis: 0 at 4,098.23, 0.236 at 4,452.20 (strong support), 0.382 at 4,671.19 (immediate support – cleared), 0.50 at 4,848.18 (key resistance above confluence), 0.618 at 5,025.17 (major resistance). The 4,550 to 4,848.18 zone is the defined reaction range with strong buying at the lower end and established resistance at the upper end.
Key Technical Levels for Gold (XAUUSD)
The following levels are identified in this Gold educational technical chart analysis. All levels are derived from Vipul’s expert chart analysis using publicly available market data.
Resistance Levels
| Resistance Type | Price Level | Notes |
|---|---|---|
| Dual Confluence Resistance | 4,733.32 | Mid Bollinger Band + downward sloping trendline – primary resistance test |
| Key Resistance | 4,848.18 | Fibonacci 0.50 – next major resistance above the confluence zone |
| Major Resistance | 5,025.17 | Fibonacci 0.618 |
Support Levels
| Support Type | Price Level | Notes |
|---|---|---|
| Immediate Support | 4,671.19 | Fibonacci 0.382 – cleared during recovery, now structural support |
| Key Support | 4,550.00 | Major structural support – retested and held decisively |
| Strong Support | 4,452.20 | Fibonacci 0.236 – additional structural support below |
| Major Support | 4,098.23 | Fibonacci 0 – corrective phase base level |
Summary: Gold Technical Outlook
This Gold (XAUUSD) educational technical chart analysis for April 8, 2026 identifies a recovery structure built on the decisive hold of the 4,550 level. The advance from that retest has cleared the Fibonacci 0.382 at 4,671.19 and is approaching the dual confluence resistance at 4,733.32. RSI sustaining above 40 describes a market maintaining momentum through the recovery advance.
The 4,733.32 dual confluence resistance – where the Mid Bollinger Band and downward sloping trendline converge – is the primary structural test for the current recovery phase. The interaction between price and this zone will define whether the recovery extends toward the Fibonacci 0.50 at 4,848.18 or encounters structural resistance at the confluence. The 4,550 structural support below has been confirmed through the retest.
- 4,550 retest held decisively – major structural support confirmed
- Fibonacci 0.382 at 4,671.19 cleared, now acting as structural support
- Dual confluence at 4,733.32 – Mid Bollinger Band + trendline – primary test ahead
- RSI above 40 throughout recovery – momentum floor maintained
- Fibonacci 0.50 at 4,848.18 is the next major resistance if confluence cleared
Want Expert Analysis on a Specific Asset?
Request a custom weekly chart interpretation of Equities, Cryptos, Commodities & Indices from Chartrick’s team of experienced technical analysts. Delivered to your inbox within 2 working days.
Decoding the Language of Charts.
Important Disclaimer
All content on Chartrick, including charts, analysis reports, articles, and educational materials, is provided for general informational and educational purposes only. Nothing on this platform constitutes investment advice, financial advice, trading advice, or any recommendation to buy, sell, or hold any financial instrument. Financial markets carry risk, and past chart analysis does not guarantee future performance. All analysis is based on publicly available market data and is subject to change at any time. While every effort is made to ensure accuracy, Chartrick does not accept liability for any loss, damage, or financial outcome arising directly or indirectly from use of or reliance on this content, including any errors or omissions in the analysis. Users are solely responsible for their own investment and trading decisions and should exercise their own independent judgment.