Silver (XAGUSD) | Published by Chartrick’s Team of Experienced Technical Analysts
Daily Analysis
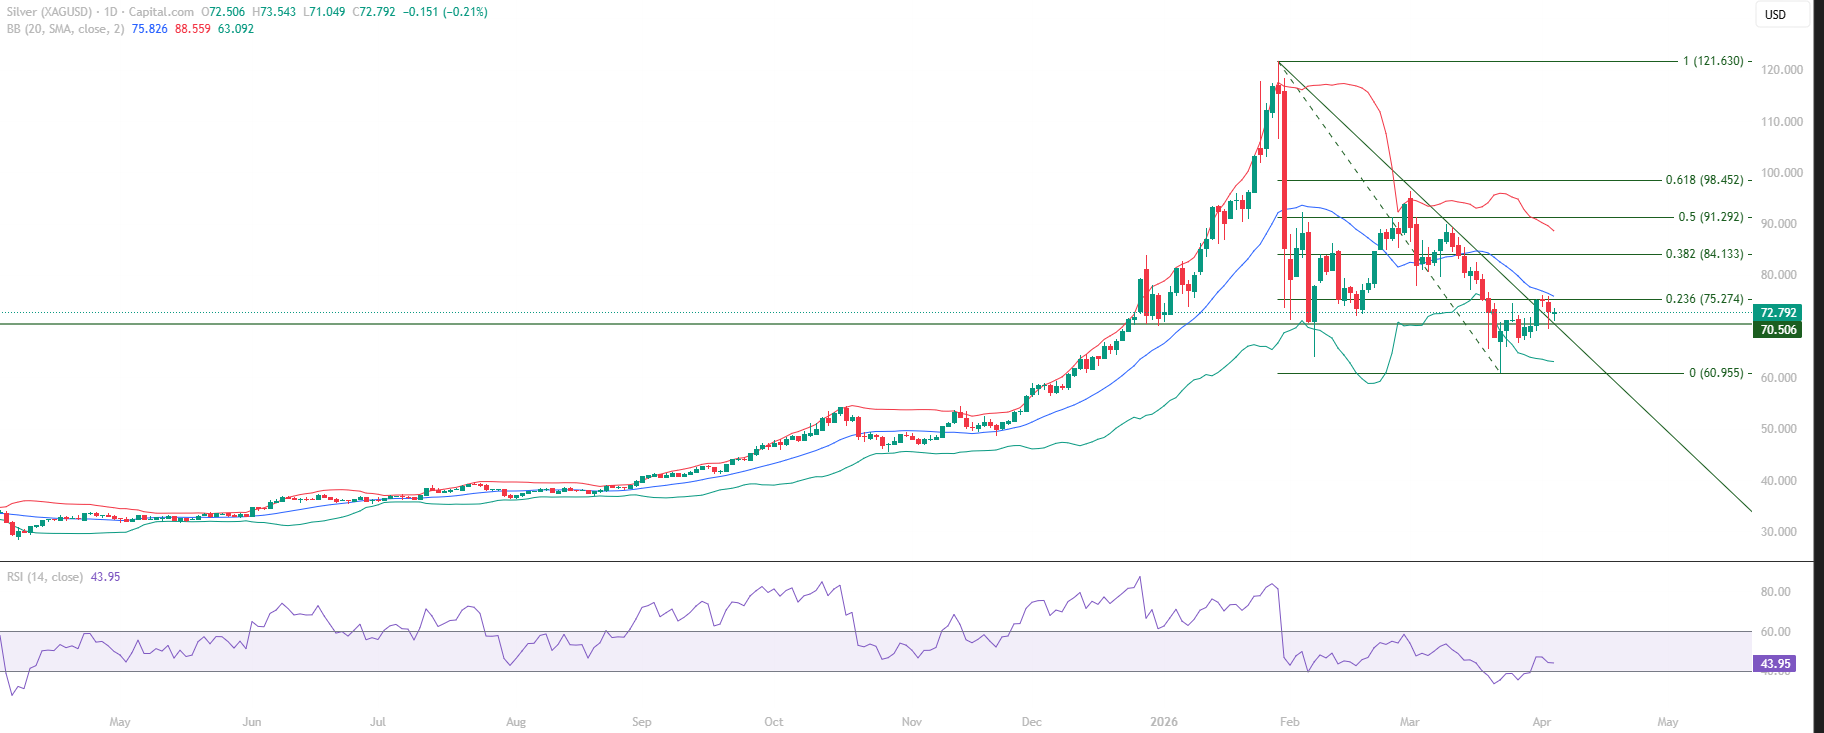
Silver (XAGUSD) educational technical chart analysis for April 7, 2026 identifies two structural developments that together describe a meaningful shift in the chart: the 70.506 resistance-to-support transition has been confirmed through a successful retest, and price has closed above the downward sloping trendline – removing the structural ceiling of the corrective phase. These two developments occurring together describe a market where the corrective structure is evolving.
This Silver chart analysis examines the quality of each development. The 70.506 polarity change is confirmed – not implied – because price has both broken above the level and retested it from above with buyers defending it. The trendline break adds a second structural layer: the overhead trendline that had been capping recovery attempts during the corrective phase has now been cleared. CMP at 72.792 sits above both structural references.
All content on this page is educational technical chart analysis provided for informational purposes only. It does not constitute investment advice or any recommendation to buy, sell, or hold any financial instrument.
What Confirms the 70.506 Polarity Change?
In this Silver educational technical chart analysis, a polarity change is confirmed rather than simply implied when price returns above a former resistance level and that level holds on a subsequent retest from above. The three-stage sequence that confirms a polarity change is: level acts as resistance (caps prior recovery attempts), level is overcome on an advance, and level holds when retested from above. The 70.506 level has completed all three stages in the current Silver structure.
The significance of a confirmed polarity change over an unconfirmed one is structural credibility. A level that has been tested from both directions and held as support after transitioning from resistance has established itself as a two-directional structural reference. The 70.506 level carries this character, making it the primary structural anchor for the current Silver consolidation above it.
- 70.506 – three-stage polarity change confirmed: resistance, breakout, retest held
- Confirmed polarity change carries more structural weight than unconfirmed breakout
- Level tested from both directions – two-directional structural reference established
- Rally from 60.955 to 76.107 established the advance; 70.506 retest confirmed the floor
- RSI sustaining above 40 – momentum floor intact alongside structural floor
What Does the Trendline Break Add Structurally?
The downward sloping trendline in this Silver chart analysis had been connecting the lower highs of the corrective phase – each time price approached it from below, sellers defended the trendline and price was rejected. A close above this trendline removes it as an active resistance boundary. Combined with the 70.506 polarity change already confirmed below, the trendline break creates a structure with two structural obstacles cleared and confirmed.
The proximity of the Mid Bollinger Band at 75.826 and the Fibonacci 0.236 at 75.274 creates a tight resistance confluence ahead – two independent resistance references within 0.55 points of each other. This compressed resistance band above is the next structural test following the trendline break.
- Downward sloping trendline break – structural ceiling of corrective phase removed
- Two structural obstacles cleared: 70.506 polarity change + trendline break
- Mid Bollinger Band at 75.826 and Fibonacci 0.236 at 75.274 – tight confluence ahead
- Compressed resistance band of 0.55 points creates concentrated overhead barrier
- 60.955 major support far below as the full structural base for the recovery
Key Technical Levels for Silver (XAGUSD)
The following levels are identified in this Silver educational technical chart analysis. All levels are derived from Vipul’s expert chart analysis using publicly available market data.
Resistance Levels
| Resistance Type | Price Level | Notes |
|---|---|---|
| Tight Confluence Resistance | 75.274 – 75.826 | Fibonacci 0.236 + Mid Bollinger Band – compressed resistance band, 0.55 pts apart |
| Strong Resistance | 84.133 | Fibonacci 0.382 – next significant level above |
| Key Resistance | 91.292 | Fibonacci 0.50 retracement |
| Major Resistance | 98.452 | Fibonacci 0.618 retracement |
Support Levels
| Support Type | Price Level | Notes |
|---|---|---|
| Key Support | 70.506 | Confirmed polarity change – resistance-to-support transition, retest held |
| Major Support | 60.955 | Fibonacci 0 – corrective phase base, foundation of the full advance |
Summary: Silver Technical Outlook
This Silver (XAGUSD) educational technical chart analysis for April 7, 2026 identifies a market that has completed two meaningful structural developments: the confirmed polarity change at 70.506 and the break above the downward sloping trendline. These two developments together describe a corrective structure that is evolving, with two overhead obstacles cleared and a compressed resistance band at 75.274 to 75.826 as the next structural test.
RSI sustaining above the 40 momentum floor maintains the constructive momentum reading for the current recovery phase. The 70.506 structural floor below is confirmed through retest and carries significant structural weight. The interaction between price and the 75.274 to 75.826 resistance confluence will provide the next directional read for Silver’s chart structure.
- 70.506 polarity change fully confirmed through three-stage sequence
- Downward sloping trendline broken – structural ceiling of corrective phase removed
- Tight resistance confluence at 75.274 to 75.826 – next structural test
- RSI above 40 – momentum floor maintained alongside confirmed structural floor
- 60.955 major support provides the structural base for the full recovery advance
Want Expert Analysis on a Specific Asset?
Request a custom weekly chart interpretation of Equities, Cryptos, Commodities & Indices from Chartrick’s team of experienced technical analysts. Delivered to your inbox within 2 working days.
Decoding the Language of Charts.
Important Disclaimer
All content on Chartrick, including charts, analysis reports, articles, and educational materials, is provided for general informational and educational purposes only. Nothing on this platform constitutes investment advice, financial advice, trading advice, or any recommendation to buy, sell, or hold any financial instrument. Financial markets carry risk, and past chart analysis does not guarantee future performance. All analysis is based on publicly available market data and is subject to change at any time. While every effort is made to ensure accuracy, Chartrick does not accept liability for any loss, damage, or financial outcome arising directly or indirectly from use of or reliance on this content, including any errors or omissions in the analysis. Users are solely responsible for their own investment and trading decisions and should exercise their own independent judgment.