Brent Crude Oil (UKOIL) | Published by Chartrick’s Team of Experienced Technical Analysts
Daily Analysis
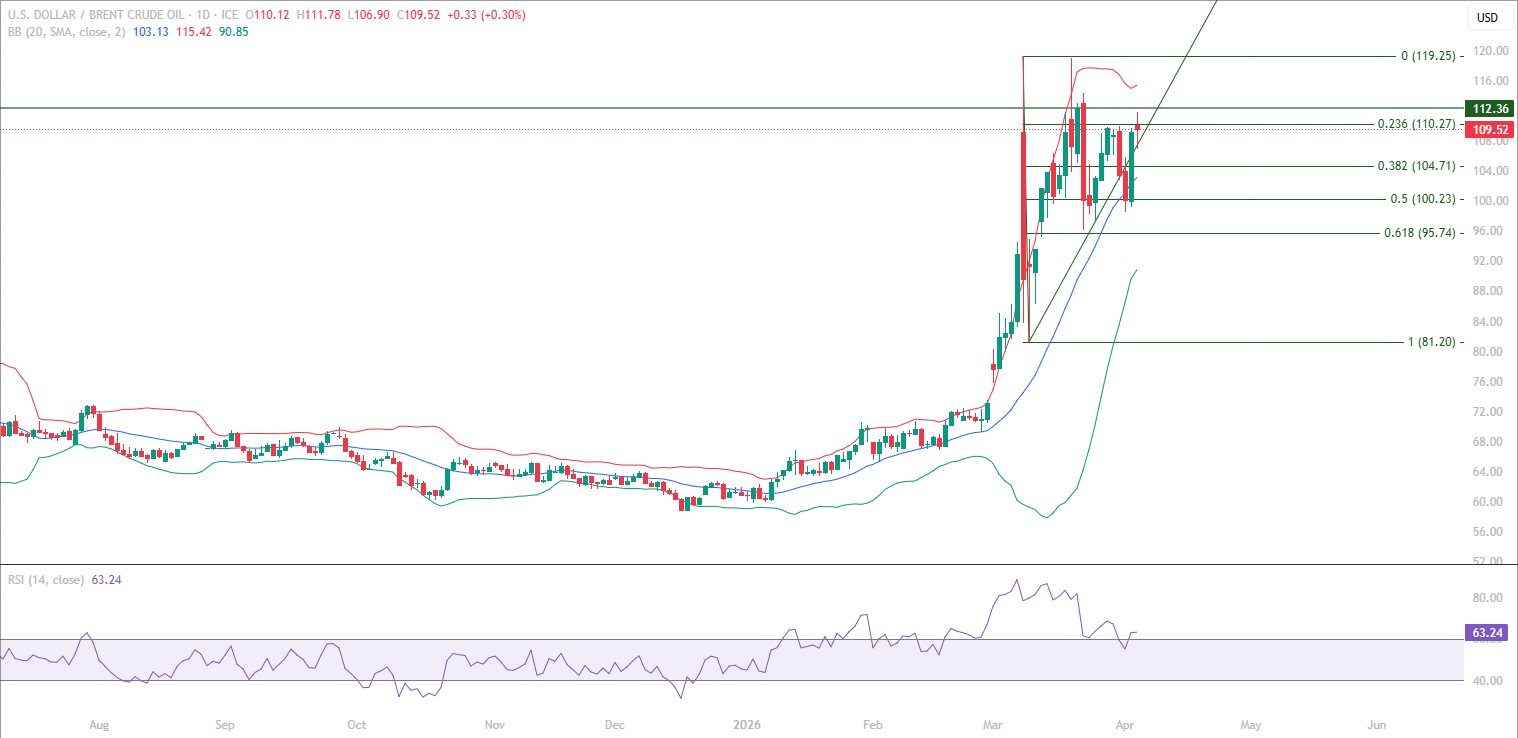
Brent Crude Oil educational technical chart analysis for April 7, 2026 identifies a structurally distinct picture from the broader market: price is consolidating near the highs of a sharp rally from the 80 zone to 119+, with RSI sustaining above the 60 level – the momentum threshold associated with continuation of upward strength rather than corrective behaviour. The uptrend trendline has been reclaimed following a retest of the psychological 100 level, adding structural confirmation to the bullish framework.
This Brent Crude Oil chart analysis examines the significance of the 104.71 level (Fibonacci 0.382), which has transitioned from resistance to support following the breakout above it. The current consolidation at CMP 109.52 places price between the Fibonacci 0.236 at 110.27 and the Mid Bollinger Band at 103.13, with RSI above 60 describing a market maintaining its upward momentum structure within the broader uptrend.
All content on this page is educational technical chart analysis provided for informational purposes only. It does not constitute investment advice or any recommendation to buy, sell, or hold any financial instrument.
What Does RSI Above 60 Describe in This Structure?
In this Brent Crude Oil educational technical chart analysis, RSI sustaining above the 60 level is the momentum signal that describes the current structure as distinctly different from the corrective structures visible in other assets. Where RSI holding the 40 level describes momentum floor defence in a corrective phase, RSI holding above 60 describes momentum ceiling maintenance in an advance phase.
The reclaim of the uptrend trendline after the 100-level retest reinforces this. The retest of the trendline at the 100 zone was a structural test that was held – price returning to the trendline and bouncing from it. This describes the trendline as an active structural support within the uptrend, not a broken reference. RSI above 60 and the trendline holding together describe a market maintaining its upward structural bias.
- RSI sustaining above 60 – momentum describes continuation of upward strength
- RSI above 60 is structurally distinct from RSI holding 40 in a corrective phase
- Uptrend trendline reclaimed after 100-level retest – trendline confirmed as active support
- Fibonacci 0.382 at 104.71 – transitioned from resistance to support after breakout
- Mid Bollinger Band at 103.13 below – acting as key dynamic support
What Is the 110.27 to 112.36 Resistance Zone?
The 110.27 Fibonacci 0.236 and the 112.36 highest closing level in the current uptrend together define the immediate resistance zone in this Brent Crude Oil chart analysis. These two references – one a Fibonacci retracement level and one a price-action high – sitting within 2.09 points of each other create a defined overhead resistance band for the consolidation phase.
Price consolidating at 109.52 below this resistance band describes a market building energy below established overhead resistance. The consolidation structure below 110.27 to 112.36, supported by RSI above 60 and the trendline holding below, describes the conditions associated with continuation structures within uptrends rather than reversal structures. The 119.25 major resistance level above represents the next significant reference if the current resistance band is cleared.
- 110.27 Fibonacci 0.236 and 112.36 prior high – dual resistance band, 2.09 pts apart
- Price consolidating at 109.52 below the resistance band – energy building below resistance
- RSI above 60 during consolidation – momentum maintaining upward bias
- 119.25 is the major resistance above if the current band is cleared
- Broad uptrend from 80 zone remains the structural context – pullbacks within uptrend
Key Technical Levels for Brent Crude Oil (UKOIL)
The following levels are identified in this Brent Crude Oil educational technical chart analysis. All levels are derived from Vipul’s expert chart analysis using publicly available market data.
Resistance Levels
| Resistance Type | Price Level | Notes |
|---|---|---|
| Immediate Resistance | 110.27 | Fibonacci 0.236 – first overhead resistance band boundary |
| Key Resistance | 112.36 | Highest closing level in current uptrend – upper resistance band boundary |
| Major Resistance | 119.25 | Fibonacci 0 – major resistance above the current resistance band |
Support Levels
| Support Type | Price Level | Notes |
|---|---|---|
| Immediate Support | 104.71 | Fibonacci 0.382 – polarity change, former resistance now structural support |
| Key Support | 103.13 | Mid Bollinger Band – dynamic structural support below |
| Strong Support | 100.23 | Fibonacci 0.50 – strong support, psychological 100 level zone |
| Major Support | 95.74 | Fibonacci 0.618 – major structural support below |
Summary: Brent Crude Oil Technical Outlook
This Brent Crude Oil educational technical chart analysis for April 7, 2026 identifies a market structure that is structurally distinct from the broader market – consolidating near the highs of a sharp advance with RSI above 60 and the uptrend trendline acting as active support below. The Fibonacci 0.382 at 104.71 has transitioned from resistance to support, and the Mid Bollinger Band at 103.13 provides a second layer of structural support.
The immediate structural test is the 110.27 to 112.36 resistance band above current price. Price behaviour within this resistance band, alongside RSI maintaining above 60, will determine whether the uptrend continues toward the 119.25 major resistance or enters a more extended consolidation phase. The broader uptrend from the 80 zone remains the structural context for all current price behaviour.
- RSI above 60 – momentum structure describing continuation of upward strength
- Uptrend trendline confirmed as active support after 100-level retest
- Fibonacci 0.382 at 104.71 – polarity change confirmed, now structural support
- 110.27 to 112.36 resistance band is the immediate structural test
- 119.25 major resistance is the next reference above if resistance band cleared
Want Expert Analysis on a Specific Asset?
Request a custom weekly chart interpretation of Equities, Cryptos, Commodities & Indices from Chartrick’s team of experienced technical analysts. Delivered to your inbox within 2 working days.
Decoding the Language of Charts.
Important Disclaimer
All content on Chartrick, including charts, analysis reports, articles, and educational materials, is provided for general informational and educational purposes only. Nothing on this platform constitutes investment advice, financial advice, trading advice, or any recommendation to buy, sell, or hold any financial instrument. Financial markets carry risk, and past chart analysis does not guarantee future performance. All analysis is based on publicly available market data and is subject to change at any time. While every effort is made to ensure accuracy, Chartrick does not accept liability for any loss, damage, or financial outcome arising directly or indirectly from use of or reliance on this content, including any errors or omissions in the analysis. Users are solely responsible for their own investment and trading decisions and should exercise their own independent judgment.