Bitcoin (BTC) | Published by Chartrick’s Team of Experienced Technical Analysts
Daily Analysis
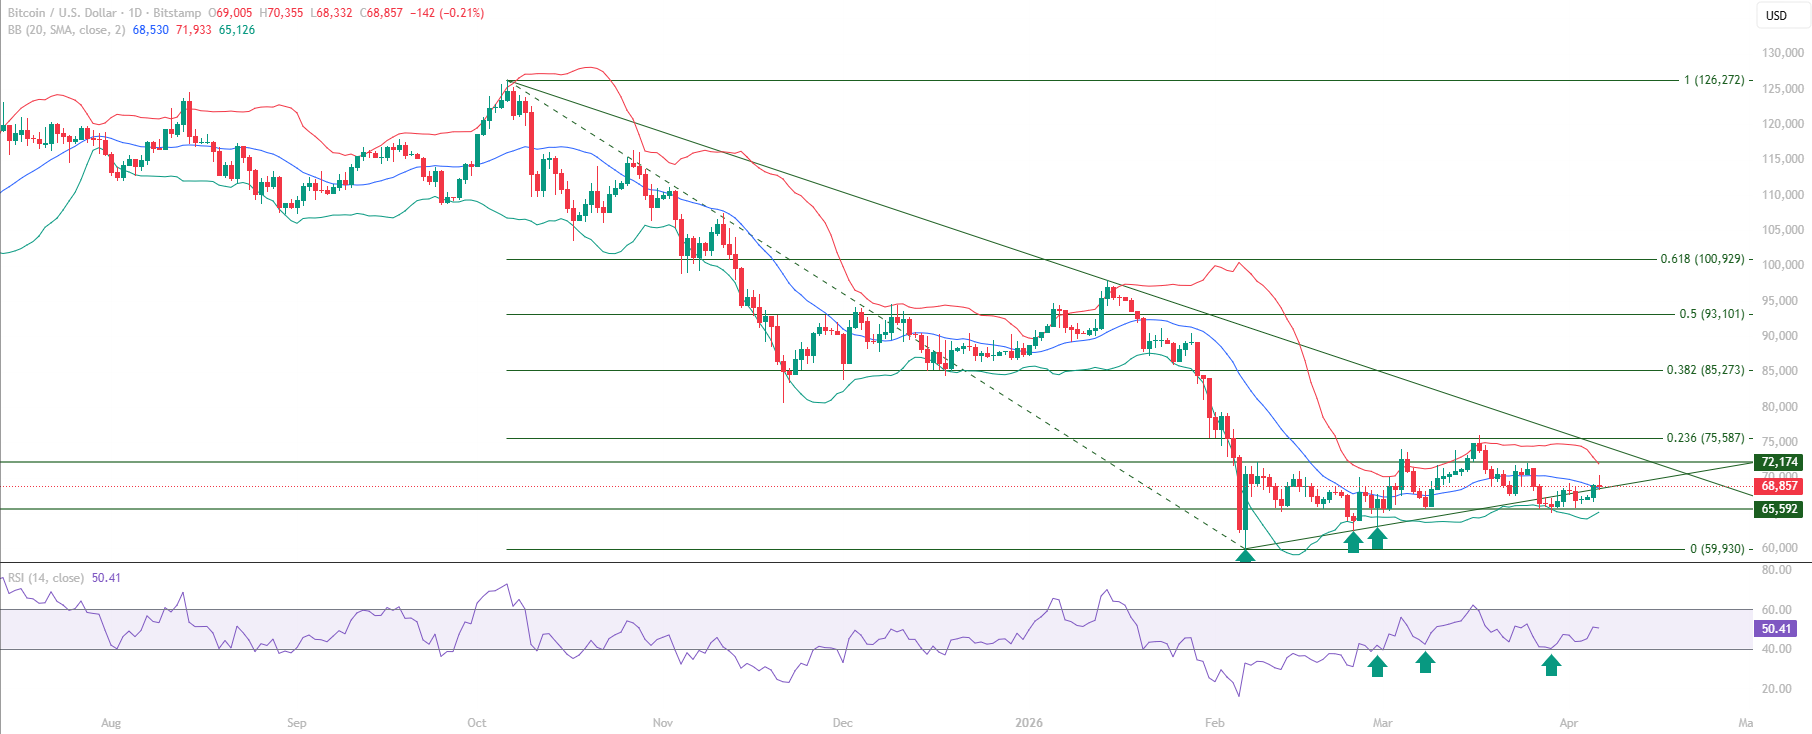
Bitcoin (BTC) educational technical chart analysis for April 7, 2026 identifies a consolidation phase that is showing structural characteristics associated with base formation behaviour. Price is closing marginally above the Mid Bollinger Band at 68,530 and holding above the reclaimed upward sloping trendline, while RSI has crossed above the 40 level and is sustaining on multiple retests – a pattern of momentum floor defence that this chart analysis identifies as consistent with base formation dynamics.
This Bitcoin chart analysis examines the 65,592 to 72,174 zone as the immediate reaction area within the broader 59,930 to 75,587 consolidation range. The CMP at 68,857 places Bitcoin in this immediate reaction zone, above both the Mid Bollinger Band and the reclaimed trendline. The 75,587 Fibonacci 0.236 remains the primary resistance barrier and the level that defines whether the base formation resolves into a broader recovery.
All content on this page is educational technical chart analysis provided for informational purposes only. It does not constitute investment advice or any recommendation to buy, sell, or hold any financial instrument.
What Characterises Base Formation Behaviour?
In this Bitcoin educational technical chart analysis, base formation behaviour is characterised by three observable chart patterns working together: accumulation at lower levels (buyers stepping in at structurally defined price zones), RSI holding the 40 level on multiple retests without breaking (momentum floor defence rather than deterioration), and no new cycle lows established despite multiple tests of the support zone. The current Bitcoin structure exhibits all three characteristics.
The reclaimed trendline is an additional structural signal within the base formation context. An upward sloping trendline that was broken during the corrective phase and is now reclaimed and holding as support describes a structural improvement within the consolidation – the market’s behaviour at the trendline has shifted from breakdown to support maintenance. This conversion adds structural stability to the base formation.
- Accumulation at lower levels – buyers responding at structurally defined price zones
- RSI 40 held on multiple retests – momentum floor defence consistent with base formation
- No new cycle lows since 59,930 established – corrective pressure not generating new lows
- Reclaimed upward sloping trendline acting as structural support – trendline conversion confirmed
- Mid Bollinger Band at 68,530 above trendline – layered support structure below price
What Is the 65,592 to 72,174 Immediate Reaction Zone?
The 65,592 to 72,174 zone in this Bitcoin chart analysis defines the immediate reaction area within the broader consolidation range. This zone is bounded by two structural references: 65,592 as a key support level below and 72,174 as the key resistance above. Price currently at 68,857 sits in the middle of this reaction zone, with the reclaimed trendline and Mid Bollinger Band providing support references below within the zone.
The significance of this zone is that it is where the near-term structural decisions are made. The 75,587 Fibonacci 0.236 is the major barrier above the immediate reaction zone – clearing both 72,174 and 75,587 would represent the base formation resolving into a broader recovery. The reaction zone behaviour, alongside RSI sustaining above 40, will provide the primary structural read for the near-term chart direction.
- 65,592 to 72,174 – immediate reaction zone, current price in middle of this range
- 72,174 key resistance is the first barrier within the immediate reaction zone
- 75,587 Fibonacci 0.236 is the major barrier above the reaction zone
- RSI sustaining above 40 – momentum floor maintained within the reaction zone
- Broader 59,930 to 75,587 consolidation range – the full structural context
Key Technical Levels for Bitcoin (BTC)
The following levels are identified in this Bitcoin educational technical chart analysis. All levels are derived from Vipul’s expert chart analysis using publicly available market data.
Resistance Levels
| Resistance Type | Price Level | Notes |
|---|---|---|
| Key Resistance | 72,174 | Immediate resistance within the reaction zone |
| Major Resistance | 75,587 | Fibonacci 0.236 – primary barrier for base formation resolution |
| Strong Resistance | 85,273 | Fibonacci 0.382 – next significant level above |
| Key Resistance | 93,101 | Fibonacci 0.50 retracement |
Support Levels
| Support Type | Price Level | Notes |
|---|---|---|
| Immediate Support | 68,530 | Mid Bollinger Band – dynamic structural support |
| Key Support | 65,592 | Structural support – lower boundary of immediate reaction zone |
| Major Support | 59,930 | Fibonacci 0 – corrective phase base, consolidation range floor |
Summary: Bitcoin Technical Outlook
This Bitcoin (BTC) educational technical chart analysis for April 7, 2026 identifies a base formation structure built on three observable characteristics: accumulation at lower levels, RSI 40 momentum floor defence across multiple retests, and no new cycle lows established. The reclaimed trendline and Mid Bollinger Band above it provide layered structural support below current price.
The 65,592 to 72,174 immediate reaction zone is the near-term structural focus, with 72,174 and 75,587 as the resistance references above. RSI sustaining above 40 maintains the base formation momentum structure. The broader uptrend on the long-term timeframe remains intact, with the current consolidation described as a base formation phase within a continuing uptrend context.
- Three base formation characteristics confirmed: accumulation, RSI 40 defence, no new lows
- Reclaimed trendline holding as structural support – trendline conversion confirmed
- Mid Bollinger Band at 68,530 – layered structural support alongside trendline
- 75,587 Fibonacci 0.236 is the primary barrier for base formation resolution
- Broader long-term uptrend intact – base formation within continuing uptrend context
Want Expert Analysis on a Specific Asset?
Request a custom weekly chart interpretation of Equities, Cryptos, Commodities & Indices from Chartrick’s team of experienced technical analysts. Delivered to your inbox within 2 working days.
Decoding the Language of Charts.
Important Disclaimer
All content on Chartrick, including charts, analysis reports, articles, and educational materials, is provided for general informational and educational purposes only. Nothing on this platform constitutes investment advice, financial advice, trading advice, or any recommendation to buy, sell, or hold any financial instrument. Financial markets carry risk, and past chart analysis does not guarantee future performance. All analysis is based on publicly available market data and is subject to change at any time. While every effort is made to ensure accuracy, Chartrick does not accept liability for any loss, damage, or financial outcome arising directly or indirectly from use of or reliance on this content, including any errors or omissions in the analysis. Users are solely responsible for their own investment and trading decisions and should exercise their own independent judgment.