Silver (XAGUSD) | Published by Chartrick’s Team of Experienced Technical Analysts
Daily Analysis
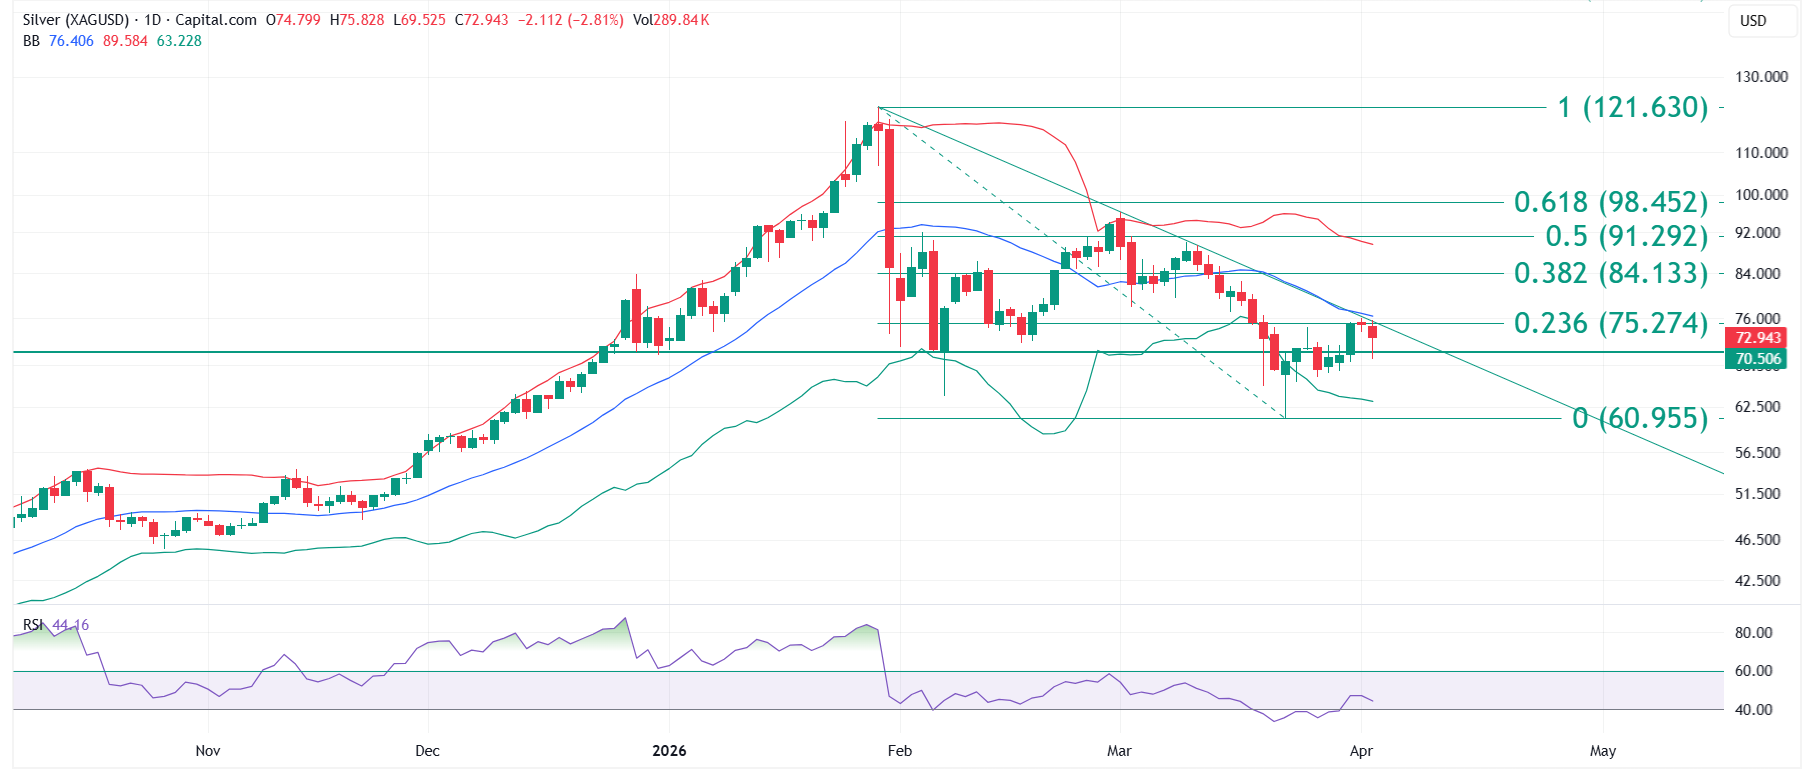
Silver (XAGUSD) educational technical chart analysis for April 6, 2026 identifies the 70.506 resistance-to-support transition as the defining structural development of the current phase. Price rallied sharply from the 60.955 base to 76.107, retested 70.506 from above, and has bounced back – confirming the polarity change at this level. CMP at 72.943 sits above the 70.506 structural floor, with RSI holding above the 40 momentum level and price approaching the Mid Bollinger Band and downward sloping trendline resistance zone.
This Silver chart analysis examines the recovery structure building above the 70.506 confirmed support. The trendline from the corrective phase and the Mid Bollinger Band at 76.406 create a resistance confluence above – the structural test that will determine whether the recovery phase develops further or encounters overhead resistance at this zone. The Fibonacci 0.236 at 75.274 sits just below the confluence, adding a third resistance reference in a compressed band.
All content on this page is educational technical chart analysis provided for informational purposes only. It does not constitute investment advice or any recommendation to buy, sell, or hold any financial instrument.
How Is the 70.506 Polarity Change Confirmed?
In this Silver educational technical chart analysis, the 70.506 polarity change is confirmed through the retest sequence. The three stages of a confirmed polarity change are: the level acts as resistance (capping prior recovery attempts), the level is overcome on an advance, and the level holds when retested from above. The 70.506 level has completed all three stages – former resistance, broken above, and retest held. This confirmation sequence is what distinguishes a confirmed polarity change from an unconfirmed breakout.
The structural weight of the confirmed 70.506 support is meaningful for the current recovery. Price building a recovery structure above a confirmed polarity change level has different structural quality than building above an unconfirmed level. The 70.506 carries buyer memory and documented price behaviour from both directions, making it a robust structural anchor for the recovery above it.
- 70.506 – three-stage polarity change confirmed: resistance, breakout, retest held
- Confirmed polarity change carries more structural weight than unconfirmed breakout
- Level tested from both directions – two-directional market memory established
- Sharp rally from 60.955 to 76.107 established the advance; 70.506 retest confirmed floor
- RSI above 40 – momentum floor intact alongside structural floor at 70.506
What Is the Resistance Confluence Above?
The resistance zone above current price in this Silver chart analysis is characterised by three references in close proximity: the Fibonacci 0.236 at 75.274, the Mid Bollinger Band at 76.406, and the downward sloping trendline from the corrective phase aligning near the same area. These three independent signals converging in the same zone create a structurally dense resistance band that will define whether the recovery phase extends further above it or stalls.
RSI approaching the 40 level on the current retest within the recovery structure is the momentum reference to watch. Holding above 40 maintains the recovery momentum structure. A break below 40 would describe weakening momentum within the recovery phase. The RSI behaviour at this level alongside price behaviour near the resistance confluence will provide the dual signal for the near-term structural read.
- Fibonacci 0.236 at 75.274 – first resistance reference in the confluence zone
- Mid Bollinger Band at 76.406 – dynamic resistance, part of the overhead confluence
- Downward sloping trendline aligns near the same zone – triple resistance confluence
- RSI at 40 level retest – momentum floor test within the recovery structure
- 60.955 major support below as the structural base of the full recovery
Key Technical Levels for Silver (XAGUSD)
The following levels are identified in this Silver educational technical chart analysis. All levels are derived from Vipul’s expert chart analysis using publicly available market data.
Resistance Levels
| Resistance Type | Price Level | Notes |
|---|---|---|
| Immediate Resistance | 75.274 | Fibonacci 0.236 – first overhead resistance level |
| Confluence Resistance | 76.406 | Mid Bollinger Band + downward sloping trendline – dual confluence overhead |
| Strong Resistance | 84.133 | Fibonacci 0.382 – next significant level above |
| Key Resistance | 91.292 | Fibonacci 0.50 retracement |
Support Levels
| Support Type | Price Level | Notes |
|---|---|---|
| Key Support | 70.506 | Confirmed polarity change – resistance-to-support transition, retest held |
| Major Support | 60.955 | Fibonacci 0 – corrective phase base, foundation of full recovery advance |
Summary: Silver Technical Outlook
This Silver (XAGUSD) educational technical chart analysis for April 6, 2026 identifies a recovery structure built on the confirmed 70.506 structural floor. The polarity change at this level has been verified through a completed three-stage sequence, and price is consolidating above this anchor with RSI holding the 40 momentum level. The Fibonacci 0.236 at 75.274 and the Mid Bollinger Band and trendline confluence at 76.406 define the resistance structure above.
The near-term structural question is whether Silver can push through the resistance confluence at 75.274 to 76.406 with RSI maintaining above 40. The interaction between price and this zone will define the next phase of the recovery structure. The 70.506 confirmed structural floor provides the anchor for the current advance.
- 70.506 polarity change confirmed through three-stage sequence – structural anchor
- RSI above 40 – momentum floor maintained within recovery structure
- Fibonacci 0.236 at 75.274 is the first resistance above current price
- 76.406 dual confluence (Mid BB + trendline) is the key resistance zone
- 60.955 major support provides the full structural base of the recovery
Want Expert Analysis on a Specific Asset?
Request a custom weekly chart interpretation of Equities, Cryptos, Commodities & Indices from Chartrick’s team of experienced technical analysts. Delivered to your inbox within 2 working days.
Decoding the Language of Charts.
Important Disclaimer
All content on Chartrick, including charts, analysis reports, articles, and educational materials, is provided for general informational and educational purposes only. Nothing on this platform constitutes investment advice, financial advice, trading advice, or any recommendation to buy, sell, or hold any financial instrument. Financial markets carry risk, and past chart analysis does not guarantee future performance. All analysis is based on publicly available market data and is subject to change at any time. While every effort is made to ensure accuracy, Chartrick does not accept liability for any loss, damage, or financial outcome arising directly or indirectly from use of or reliance on this content, including any errors or omissions in the analysis. Users are solely responsible for their own investment and trading decisions and should exercise their own independent judgment.