Brent Crude Oil (UKOIL) | Published by Chartrick’s Team of Experienced Technical Analysts
Daily Analysis
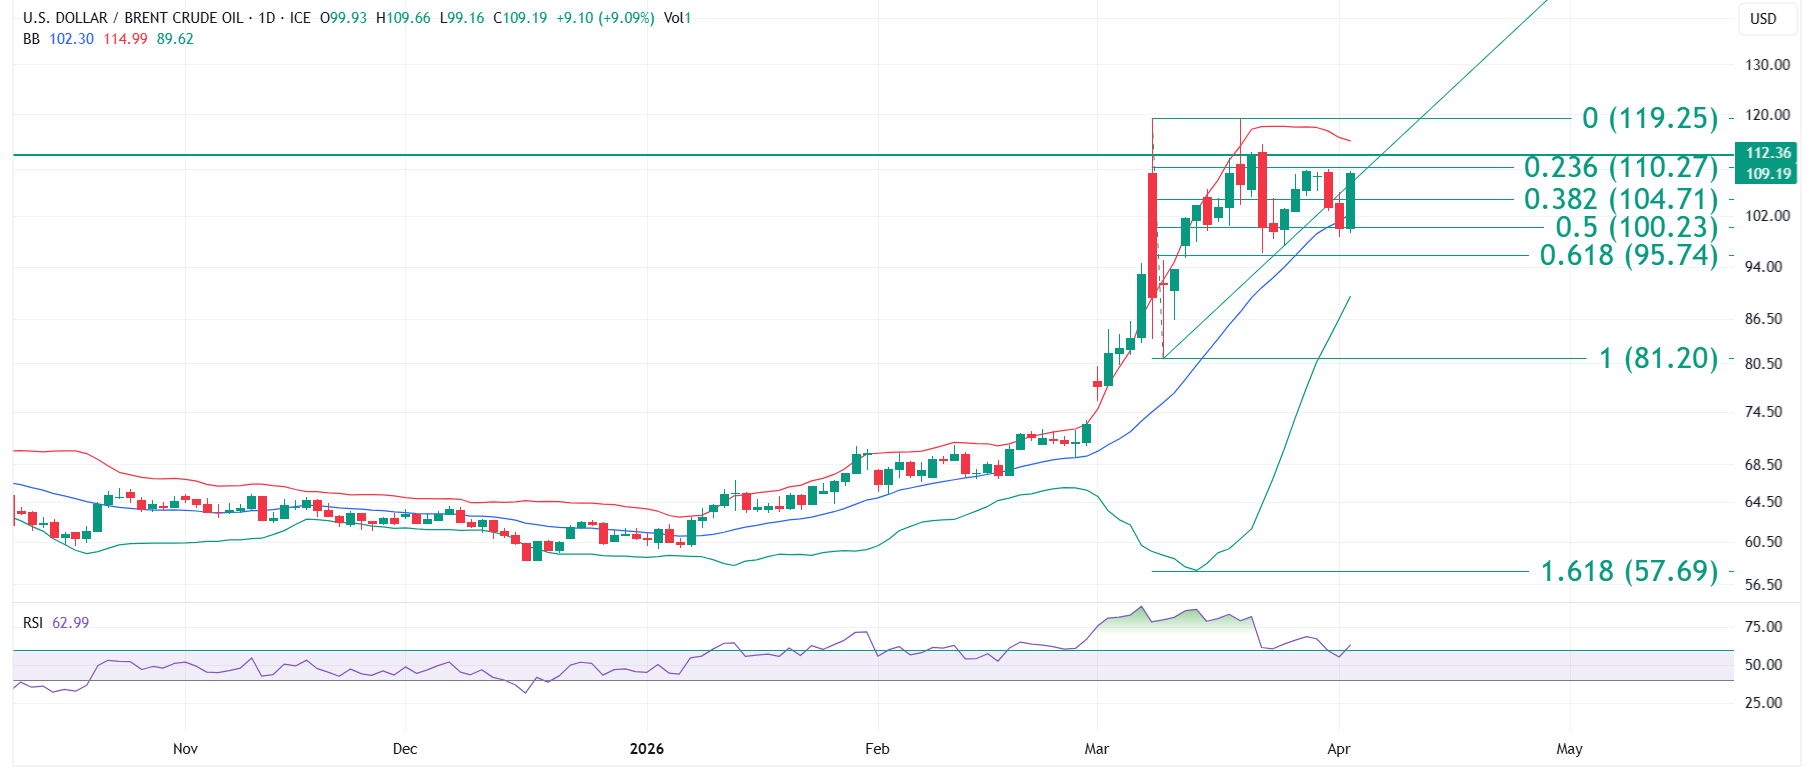
Brent Crude Oil educational technical chart analysis for April 6, 2026 identifies a structurally distinct chart from the broader market context. Price has rebounded sharply from the 100 psychological level, reclaimed the key uptrend trendline, and moved above the Mid Bollinger Band at 102.30 – which may now act as a critical support zone. RSI has moved above the 60 level, describing a momentum structure associated with continuation of upward strength within the broader uptrend from the 80 zone.
This Brent Crude Oil chart analysis examines the significance of three simultaneous structural developments: the rebound from the 100 level, the trendline reclaim, and the RSI break above 60. These three developments occurring together describe a market where the corrective retest of the 100 zone was absorbed and the uptrend structure has reasserted. CMP at 109.19 places Brent below the Fibonacci 0.236 at 110.27 – the immediate resistance test for the continuation structure.
All content on this page is educational technical chart analysis provided for informational purposes only. It does not constitute investment advice or any recommendation to buy, sell, or hold any financial instrument.
What Do the Three Simultaneous Developments Signal?
In this Brent Crude Oil educational technical chart analysis, the three developments occurring together carry more structural weight than any single signal alone. The 100 level rebound established price support at a psychologically significant and structurally recognised zone. The uptrend trendline reclaim removed the structural overhead concern created by the corrective break below it. And the RSI move above 60 upgraded the momentum reading from corrective to continuation-consistent.
The combination of these three signals at the same time describes a structural moment where price, structure, and momentum are all pointing in the same direction following the corrective retest. This type of multi-signal alignment is what this Brent Crude Oil chart analysis identifies as the defining technical event for the current structure.
- 100 level rebound – psychologically significant structural support held on retest
- Uptrend trendline reclaimed – structural overhead concern from corrective break removed
- RSI above 60 – momentum upgraded from corrective to continuation-consistent
- Mid Bollinger Band at 102.30 – moved above, may act as critical support zone
- Fibonacci 0.382 at 104.71 – polarity change from resistance to structural support
What Is the Near-Term Resistance Structure?
With CMP at 109.19, Brent Crude Oil is approaching the Fibonacci 0.236 at 110.27 in this chart analysis. This level represents the first significant Fibonacci resistance above current price. The 112.36 highest closing level in the current uptrend sits just above it, creating a 2.09-point resistance band at the upper end of the consolidation structure.
Price consolidating below the 110.27 to 112.36 resistance band with RSI above 60 describes a market building energy below established overhead resistance within an uptrend. This consolidation structure – RSI above 60, price below resistance – is associated with continuation patterns within uptrends rather than reversal structures. The 119.25 Fibonacci 0 level represents the major resistance above the resistance band.
- Fibonacci 0.236 at 110.27 – immediate resistance, first overhead test
- 112.36 highest closing level – upper boundary of the resistance band, 2.09 pts above
- 119.25 Fibonacci 0 – major resistance above the resistance band
- Consolidation below resistance with RSI above 60 – continuation-consistent structure
- Mid Bollinger Band at 102.30 and Fibonacci 0.382 at 104.71 – layered support below
Fibonacci Framework
The Fibonacci retracement framework for Brent Crude Oil in this educational technical chart analysis measures the corrective move from the 119.25 high: 0 at 119.25 (major resistance), 0.236 at 110.27 (immediate resistance), 0.382 at 104.71 (structural support after polarity change), 0.50 at 100.23 (psychological 100 zone, corrective retest held), 0.618 at 95.74 (strong support below). Price at 109.19 is between the 0.382 and 0.236 levels, with RSI above 60 describing upward momentum structure.
Key Technical Levels for Brent Crude Oil (UKOIL)
The following levels are identified in this Brent Crude Oil educational technical chart analysis. All levels are derived from Vipul’s expert chart analysis using publicly available market data.
Resistance Levels
| Resistance Type | Price Level | Notes |
|---|---|---|
| Immediate Resistance | 110.27 | Fibonacci 0.236 – immediate overhead test below resistance band upper boundary |
| Key Resistance | 112.36 | Highest closing level in uptrend – upper resistance band boundary |
| Major Resistance | 119.25 | Fibonacci 0 – major resistance above the resistance band |
Support Levels
| Support Type | Price Level | Notes |
|---|---|---|
| Immediate Support | 104.71 | Fibonacci 0.382 – polarity change from resistance to structural support |
| Key Support | 102.30 | Mid Bollinger Band – moved above, critical support zone below current price |
| Strong Support | 100.23 | Fibonacci 0.50 – psychological 100 level, corrective retest held |
| Major Support | 95.74 | Fibonacci 0.618 – strong structural support below |
Summary: Brent Crude Oil Technical Outlook
This Brent Crude Oil educational technical chart analysis for April 6, 2026 identifies a market that has executed three simultaneous structural developments following the corrective retest of the 100 level: trendline reclaim, RSI break above 60, and Mid Bollinger Band cleared. The Fibonacci 0.382 at 104.71 has transitioned from resistance to support.
The immediate structural test is the Fibonacci 0.236 at 110.27 and the 110.27 to 112.36 resistance band above current price. Price consolidating below this resistance band with RSI above 60 describes a continuation-consistent structure within the broader uptrend from the 80 zone. The three simultaneous developments from the corrective retest describe a market where the uptrend structure has reasserted.
- Three simultaneous developments signal uptrend structure reasserting after 100 retest
- RSI above 60 – momentum structure consistent with uptrend continuation
- Fibonacci 0.382 at 104.71 – polarity change confirmed, now structural support
- 110.27 to 112.36 resistance band is the near-term structural test
- Mid Bollinger Band at 102.30 – critical support zone below current price
Want Expert Analysis on a Specific Asset?
Request a custom weekly chart interpretation of Equities, Cryptos, Commodities & Indices from Chartrick’s team of experienced technical analysts. Delivered to your inbox within 2 working days.
Decoding the Language of Charts.
Important Disclaimer
All content on Chartrick, including charts, analysis reports, articles, and educational materials, is provided for general informational and educational purposes only. Nothing on this platform constitutes investment advice, financial advice, trading advice, or any recommendation to buy, sell, or hold any financial instrument. Financial markets carry risk, and past chart analysis does not guarantee future performance. All analysis is based on publicly available market data and is subject to change at any time. While every effort is made to ensure accuracy, Chartrick does not accept liability for any loss, damage, or financial outcome arising directly or indirectly from use of or reliance on this content, including any errors or omissions in the analysis. Users are solely responsible for their own investment and trading decisions and should exercise their own independent judgment.