Bitcoin (BTC) | Published by Chartrick’s Team of Experienced Technical Analysts
Daily Analysis
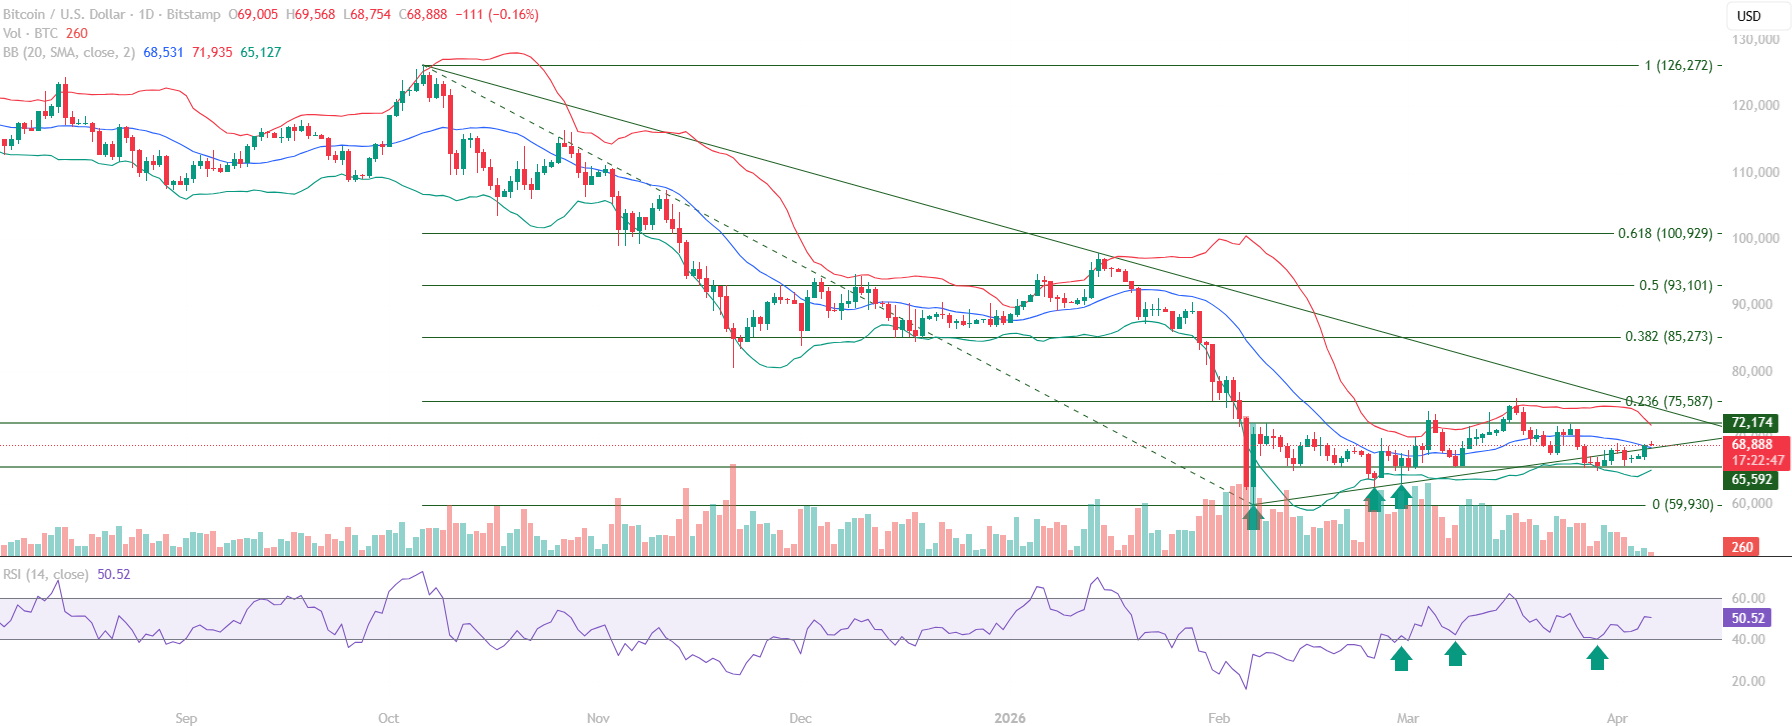
Bitcoin (BTC) educational technical chart analysis for April 6, 2026 identifies a market in a consolidation phase near recent lows that is exhibiting early structural characteristics of base formation behaviour. Price has moved above the Mid Bollinger Band at 68,783 and is holding above the reclaimed upward sloping trendline, while RSI has crossed above the 40 level and is being retested on multiple occasions – sustaining above it consistently. CMP at 68,999 places Bitcoin just above the Mid Bollinger Band reference.
This Bitcoin chart analysis examines the structural significance of the RSI 40 pattern observed in the current consolidation. The 75,587 Fibonacci 0.236 remains the key resistance barrier, while the 65,592 to 72,174 zone is the immediate reaction area. The trendline reclaim and RSI 40 hold together describe a market where improving structural stability is visible within the consolidation range.
All content on this page is educational technical chart analysis provided for informational purposes only. It does not constitute investment advice or any recommendation to buy, sell, or hold any financial instrument.
What Does Base Formation Behaviour Look Like in This Chart?
In this Bitcoin educational technical chart analysis, base formation behaviour is identified through three observable chart characteristics working together. First, accumulation at lower levels: buyers stepping in at structurally defined price zones within the 59,930 to 75,587 consolidation range, preventing the establishment of new cycle lows. Second, RSI 40 level holding across multiple retests: the momentum indicator being tested at the 40 level on multiple occasions and sustaining above it each time – describing a market where selling pressure is not gaining momentum below this threshold.
Third, the reclaimed trendline acting as structural support below price: an upward sloping trendline that was broken during the corrective phase has been reclaimed and is now holding as support. These three characteristics – accumulation, RSI 40 defence, and trendline reclaim holding – describe a market building the structural foundation associated with base formation prior to a potential directional resolution.
- Accumulation at lower levels – buyers responding at structural price zones within the range
- RSI 40 retested on multiple occasions and sustaining above each time – momentum floor defence
- No new cycle lows since 59,930 established – corrective pressure absorbed at structural levels
- Reclaimed upward sloping trendline holding as structural support below price
- Mid Bollinger Band at 68,783 – cleared, may act as dynamic support zone below CMP
What Is the Structural Significance of RSI 40 Holding on Multiple Retests?
In this Bitcoin chart analysis, the pattern of RSI retesting the 40 level and sustaining above it on multiple occasions is a momentum floor pattern with increasing structural credibility. Each retest that holds adds to the documented evidence that the 40 level is functioning as active momentum support rather than a level that will eventually break. A level defended once is a data point; a level defended across multiple retests across different sessions is a structural pattern.
The significance of this RSI pattern in the context of base formation is that it describes improving momentum retention at lower price levels. When price is in a consolidation range but momentum is holding at a floor level across repeated tests, it is consistent with the accumulation behaviour visible in base formation structures. The 60 level represents the next momentum threshold – a sustained move above RSI 60 would upgrade the momentum reading from base formation to a more confirmed advance.
- RSI 40 – tested multiple times, sustained above each time, momentum floor credibility growing
- Each additional retest held adds structural weight to the 40 level as active momentum support
- Consistent RSI 40 defence describes improving momentum retention within the consolidation
- RSI 60 is the next momentum threshold – move above it would upgrade the structural reading
- RSI pattern consistent with accumulation phase within base formation structures
Mid Bollinger Band and Trendline Structure
The Mid Bollinger Band at 68,783 and the reclaimed upward sloping trendline together create two layers of structural support below current price in this Bitcoin educational technical chart analysis. Price moving above the Mid Bollinger Band describes a market that has crossed from the lower structural zone to the upper portion of the consolidation range. The Mid Bollinger Band now acting as a potential dynamic support zone – rather than overhead resistance – is a Bollinger Band condition consistent with improving structural bias within the consolidation.
Key Technical Levels for Bitcoin (BTC)
The following levels are identified in this Bitcoin educational technical chart analysis. All levels are derived from Vipul’s expert chart analysis using publicly available market data.
Resistance Levels
| Resistance Type | Price Level | Notes |
|---|---|---|
| Key Resistance | 72,174 | Immediate resistance within the consolidation range |
| Major Resistance | 75,587 | Fibonacci 0.236 – primary barrier for base formation resolution |
| Strong Resistance | 85,273 | Fibonacci 0.382 – next significant level above |
| Key Resistance | 93,101 | Fibonacci 0.50 retracement |
| Major Resistance | 100,929 | Fibonacci 0.618 retracement |
Support Levels
| Support Type | Price Level | Notes |
|---|---|---|
| Immediate Support | 68,783 | Mid Bollinger Band – cleared, may act as dynamic support zone |
| Key Support | 65,592 | Structural support – lower boundary of immediate reaction zone |
| Major Support | 59,930 | Fibonacci 0 – corrective phase base, consolidation range floor |
Summary: Bitcoin Technical Outlook
This Bitcoin (BTC) educational technical chart analysis for April 6, 2026 identifies a consolidation phase exhibiting three base formation characteristics: accumulation at lower levels, RSI 40 momentum floor defence across multiple retests, and the reclaimed upward sloping trendline holding as structural support. Price above the Mid Bollinger Band at 68,783 and within the immediate reaction zone of 65,592 to 72,174 describes improving structural stability within the consolidation.
The 75,587 Fibonacci 0.236 remains the primary price barrier for base formation resolution. The RSI 60 level is the next momentum threshold. The near-term structural observation is whether RSI continues to sustain above the 40 level and whether price can build toward the 72,174 immediate resistance. The broader uptrend on the long-term timeframe remains intact, with the current consolidation described as a base formation phase within a continuing uptrend context.
- Three base formation characteristics confirmed: accumulation, RSI 40 defence, trendline reclaim
- RSI 40 held on multiple retests – credibility of momentum floor growing with each defence
- Mid Bollinger Band at 68,783 cleared – potential dynamic support zone below CMP
- 75,587 Fibonacci 0.236 is the primary price barrier for base formation resolution
- Broader long-term uptrend intact – consolidation occurring within continuing uptrend context
Want Expert Analysis on a Specific Asset?
Request a custom weekly chart interpretation of Equities, Cryptos, Commodities & Indices from Chartrick’s team of experienced technical analysts. Delivered to your inbox within 2 working days.
Decoding the Language of Charts.
Important Disclaimer
All content on Chartrick, including charts, analysis reports, articles, and educational materials, is provided for general informational and educational purposes only. Nothing on this platform constitutes investment advice, financial advice, trading advice, or any recommendation to buy, sell, or hold any financial instrument. Financial markets carry risk, and past chart analysis does not guarantee future performance. All analysis is based on publicly available market data and is subject to change at any time. While every effort is made to ensure accuracy, Chartrick does not accept liability for any loss, damage, or financial outcome arising directly or indirectly from use of or reliance on this content, including any errors or omissions in the analysis. Users are solely responsible for their own investment and trading decisions and should exercise their own independent judgment.