
How Technical Analysis Works: A Guide to Technical Chart Analysis
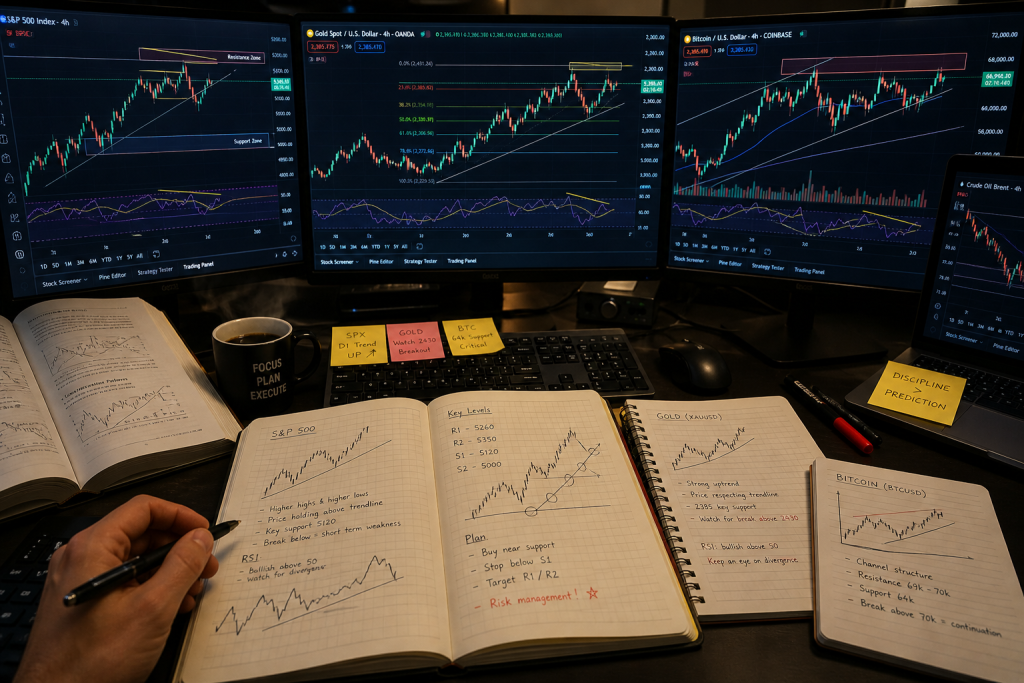
Financial markets are complex, dynamic, and often difficult to interpret. Yet within every chart lies a structured record of market behaviour – a visual history of price, momentum, and sentiment. Educational technical chart analysis is the discipline of reading that record objectively, using proven analytical frameworks to understand market structure and identify key technical levels. […]
How to Read RSI: Understanding Momentum in Financial Charts
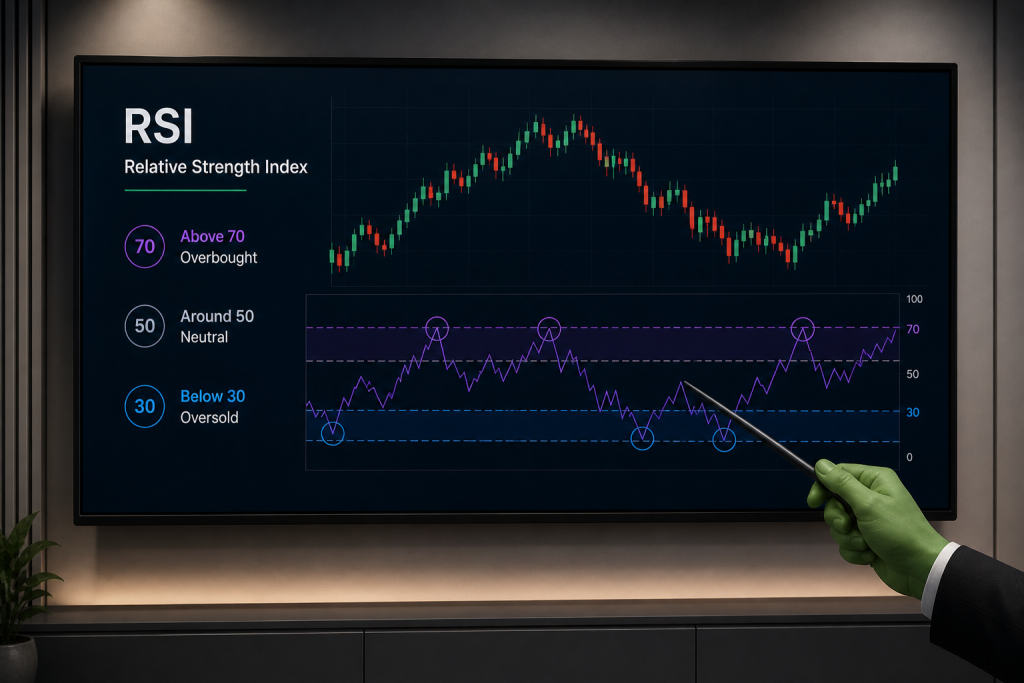
The Relative Strength Index – universally known as RSI – is one of the most widely referenced indicators in technical chart analysis. It appears in every market Chartrick covers, from the S&P 500 (SPX) and Gold (XAUUSD) to Brent Crude Oil and Bitcoin (BTC), and is a standard component of Chartrick’s daily structured market analysis […]
What Are Support and Resistance Levels? A Complete Guide to Key Technical Levels
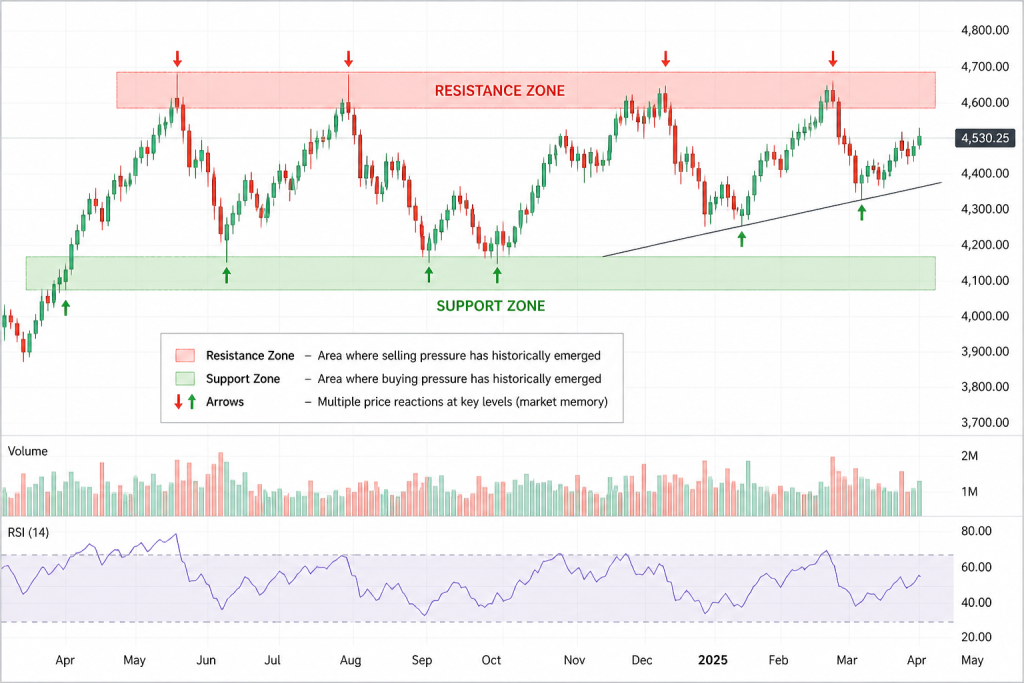
Support and resistance levels are among the most fundamental and widely referenced concepts in technical chart analysis. They appear in every Chartrick analysis published across S&P 500 (SPX), Gold (XAUUSD), Silver (XAGUSD), Brent Crude Oil, and Bitcoin (BTC) – and for good reason. These levels represent the price zones where markets have historically demonstrated a […]