
Bitcoin (BTC) | Published by Chartrick’s Team of Experienced Technical Analysts
Daily Analysis
April 23, 2026 – Wednesday
78,208 (as on 22 Apr 2026)
Base Formation Complete – Breakout Structure Building
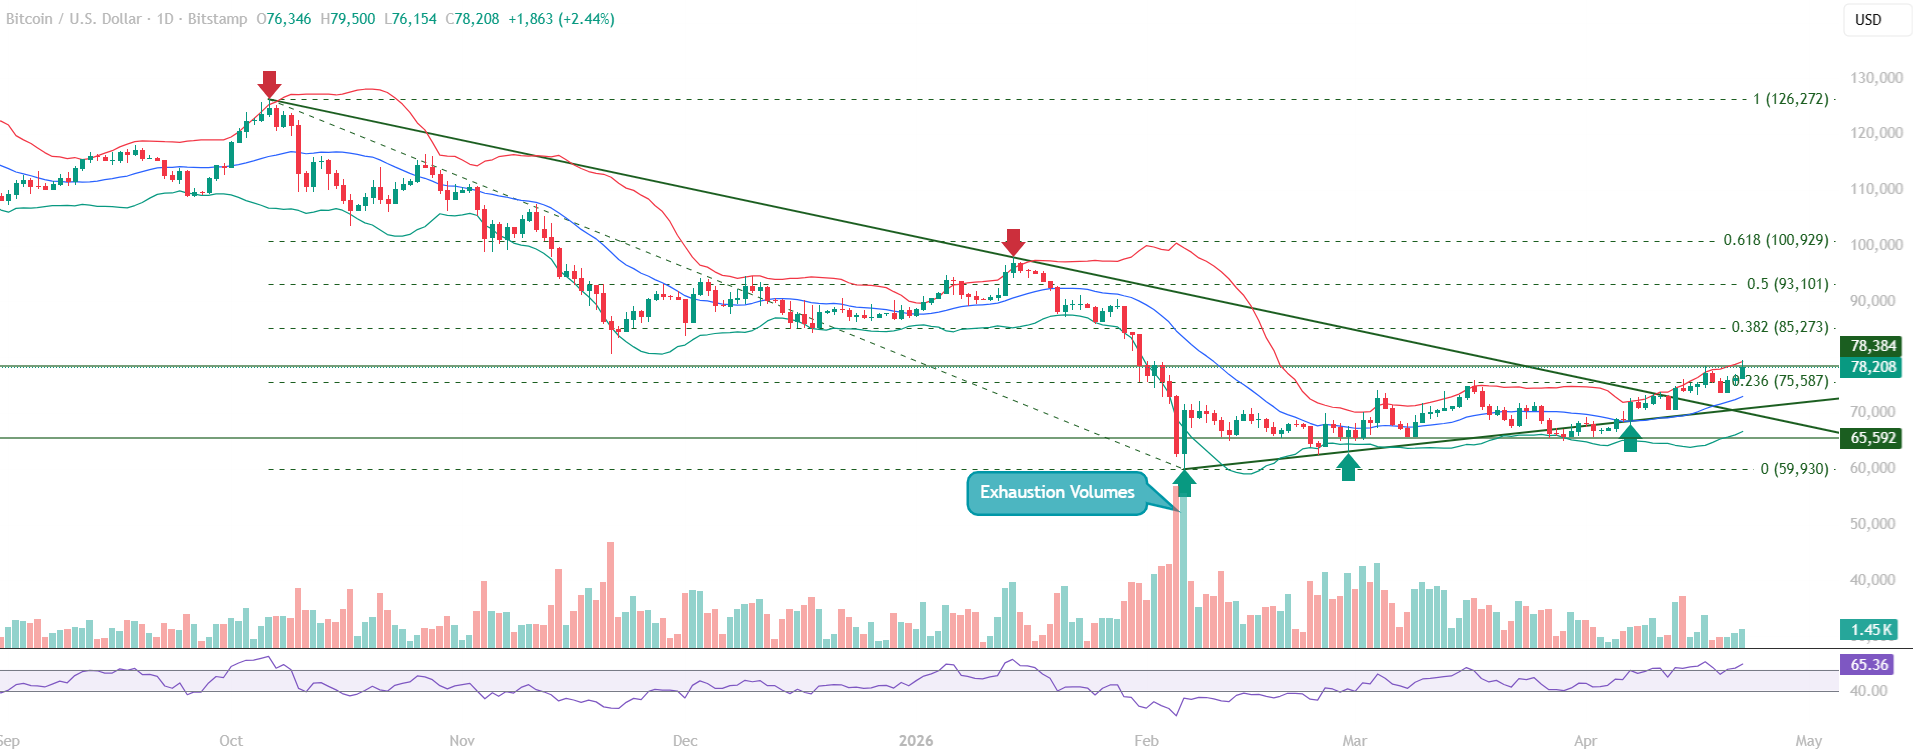
Bitcoin (BTC) educational technical chart analysis for April 23, 2026 examines a structurally significant development: price has reclaimed the Fibonacci 0.236 retracement level at 75,587, with RSI pushing above the 60 level for the first time during this recovery phase. The base formation built over the preceding weeks is now showing breakout characteristics, with the structural compression between the two trendlines resolving in a directional advance.
This Bitcoin chart analysis identifies the exhaustion volume signal from early February 2026 as the foundational context for the current structure. Elevated sell-side volume that failed to drive prices meaningfully lower marked the beginning of the base formation – a pattern characterised by diminishing selling pressure and progressive accumulation at lower structural levels. The April 23 session represents the first technical confirmation that the base is resolving upward.
All content on this page is educational technical chart analysis provided for informational purposes only. It does not constitute investment advice or any recommendation to buy, sell, or hold any financial instrument.
What Does the Current Bitcoin Chart Structure Show?
The weekly Bitcoin (BTC) chart reflects a recovery phase that has crossed a meaningful structural milestone. Price has moved above the Fibonacci 0.236 resistance at 75,587, reclaiming this level as support following its rejection earlier in the corrective phase. The downward sloping trendline formed during the broader corrective move has been broken, removing a key structural ceiling from the chart.
Two trendlines now define the structure: the broken downward sloping trendline (previously acting as resistance, now a potential support zone on a retest) and the upward sloping trendline providing structural floor beneath current price. Price consolidating between these two trendlines compressed toward a resolution – the April 23 advance describes that resolution in progress.
- Fibonacci 0.236 at 75,587 – reclaimed and now acting as structural support
- Downward sloping trendline from corrective phase – broken above, ceiling removed
- Upward sloping trendline – providing structural floor below price
- RSI moved above the 60 level – first time during this recovery phase, key signal
- Exhaustion volume in early February – foundational context for base formation
The Exhaustion Volume Foundation
The exhaustion volume pattern from early February 2026 remains the most significant structural signal in this Bitcoin chart analysis. Elevated sell-side volume that failed to produce meaningful lower prices is a technical pattern associated with diminishing selling conviction. Markets do not turn on price alone – the failure of volume to confirm a breakdown is a structural signal worth noting in any educational technical chart analysis of this period. The base formation built on this foundation has now held through multiple tests, validating the signal.
How Are the Technical Indicators Reading?
RSI analysis in this Bitcoin educational technical chart analysis shows the momentum indicator crossing above the 60 level. The 60 level is a meaningful structural threshold – it has historically defined the boundary between a recovery phase and a momentum-confirmed upswing. Sustaining above 60 supports the continuation of the current breakout attempt and is the momentum signal that distinguishes this session from prior recovery attempts.
The 40 level on RSI served as a key momentum floor throughout the base formation period, holding on multiple retests. This pattern of RSI holding above 40 while price compressed in a range is consistent with accumulation behaviour in base formation structures. The transition from holding 40 to breaking above 60 describes the full arc of the base formation momentum cycle.
- RSI above 60 – first time in the current recovery phase, momentum confirmation signal
- RSI 40 level held repeatedly during base formation – confirmed momentum floor
- Mid Bollinger Band at 72,973 – now positioned as key support below current price
- Fibonacci 0.236 at 75,587 reclaimed – structural milestone for the base formation
Key Technical Levels for Bitcoin (BTC)
The following levels are identified in this Bitcoin educational technical chart analysis. All levels are derived from Vipul’s expert chart analysis using publicly available market data.
Resistance Levels
| Resistance Type | Price Level | Notes |
|---|---|---|
| Immediate Resistance | 78,384 | Immediate resistance zone – level price is testing |
| Strong Resistance | 85,273 | Fibonacci 0.382 retracement – next major overhead level |
| Key Resistance | 93,101 | Fibonacci 0.50 retracement |
| Major Resistance | 100,929 | Fibonacci 0.618 retracement – significant overhead level |
Support Levels
| Support Type | Price Level | Notes |
|---|---|---|
| Immediate Support | 75,587 | Fibonacci 0.236 – reclaimed, now acting as structural support |
| Key Support | 72,973 | Mid Bollinger Band – structural support below |
| Broader Support | 65,592 | Key structural support level |
| Major Support | 59,930 | Fibonacci 0 – major base level, corrective phase low |
Summary: Bitcoin Technical Outlook
This Bitcoin (BTC) educational technical chart analysis for April 23, 2026 identifies a structure where the base formation built over several weeks is now testing a breakout. The Fibonacci 0.236 reclaim, RSI crossing above 60, and the broken downward sloping trendline collectively describe a market in the early stages of a structural breakout attempt.
The immediate resistance at 78,384 is the level that defines the near-term resolution. The broader Fibonacci structure above – with 0.382 at 85,273 – provides the next reference point if the current level is cleared. Any pullback toward the 75,587 to 72,973 zone would represent a test of the structural support established during this base formation phase rather than a breakdown of the structure.
- Base formation confirmed by exhaustion volume foundation in February 2026
- Fibonacci 0.236 at 75,587 reclaimed as support after multiple prior tests
- RSI above 60 signals momentum upgrade beyond simple recovery phase
- Immediate resistance at 78,384 defines the near-term breakout test
- Mid Bollinger Band at 72,973 is key structural support on any pullback
Want Expert Analysis on a Specific Asset?
Request a custom weekly chart interpretation of Equities, Cryptos, Commodities & Indices from Chartrick’s team of experienced technical analysts. Delivered to your inbox within 2 working days.
Decoding the Language of Charts.
Important Disclaimer
All content on Chartrick, including charts, analysis reports, articles, and educational materials, is provided for general informational and educational purposes only. Nothing on this platform constitutes investment advice, financial advice, trading advice, or any recommendation to buy, sell, or hold any financial instrument. Financial markets carry risk, and past chart analysis does not guarantee future performance. All analysis is based on publicly available market data and is subject to change at any time. While every effort is made to ensure accuracy, Chartrick does not accept liability for any loss, damage, or financial outcome arising directly or indirectly from use of or reliance on this content, including any errors or omissions in the analysis. Users are solely responsible for their own investment and trading decisions and should exercise their own independent judgment.