Gold (XAUUSD) | Published by Chartrick’s Team of Experienced Technical Analysts
Daily Analysis
April 15, 2026 – Tuesday
4,841.30 (as on 14 Apr 2026)
Bounce Phase / Recovery within Broader Downtrend – Approaching Fibonacci 0.50
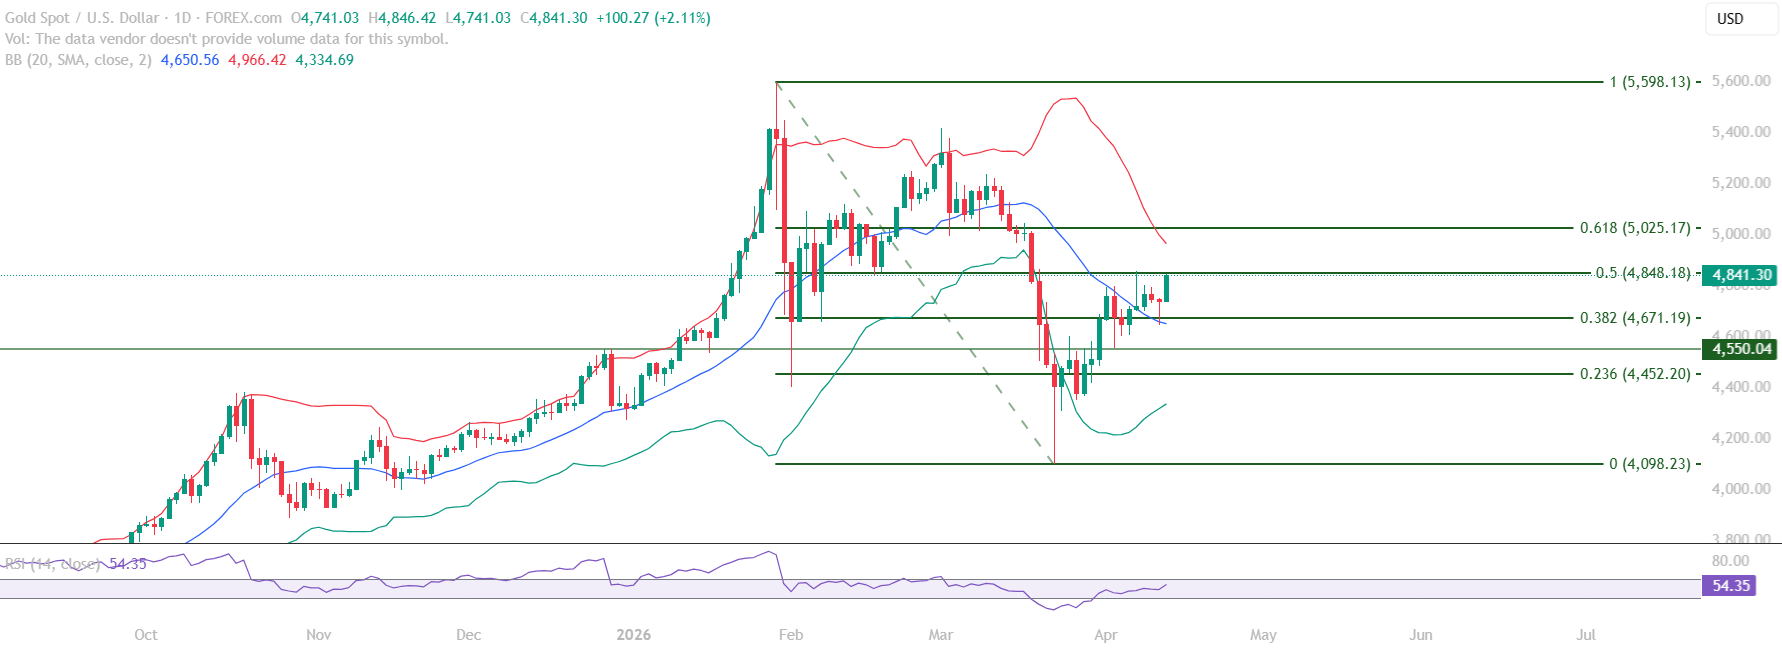
Gold (XAUUSD) educational technical chart analysis for April 15, 2026 identifies a market in a defined bounce phase, approaching the Fibonacci 0.50 resistance at 4,848.18 with RSI at 54.35 and price trading just below this key level. The structural recovery from the strong support zone at the Fibonacci 0.382 and Mid Bollinger Band confluence has driven price to within close range of the next major resistance test.
This Gold chart analysis examines the quality of the recovery: the 4,650 to 4,671.19 confluence zone, where the Fibonacci 0.382 and the Mid Bollinger Band aligned, provided strong buying support, and the advance from that zone has been consistent in its progress toward the Fibonacci 0.50 resistance. The RSI progression from the 40 level to 54.35 describes improving but not yet fully confirmed momentum.
All content on this page is educational technical chart analysis provided for informational purposes only. It does not constitute investment advice or any recommendation to buy, sell, or hold any financial instrument.
Where Is Gold Building Momentum From?
The strong support zone at the 4,650 to 4,671.19 confluence is the structural foundation for the current advance. At this zone, the Fibonacci 0.382 retracement at 4,671.19 aligned with the Mid Bollinger Band – a dual technical confluence that produced a decisive response from buyers. Price bounced from this zone with improving momentum, establishing the recovery phase now approaching the Fibonacci 0.50 test.
This Gold educational technical chart analysis notes that the quality of a support zone is partly defined by how cleanly price responds to it. The 4,650 to 4,671.19 zone has provided clear structural evidence of demand. The advance from it has carried price 170+ points toward the next resistance level in an organised, directional move rather than a volatile or fragmented bounce.
- Strong confluence support zone at 4,650 to 4,671.19 – Fibonacci 0.382 plus Mid Bollinger Band
- Advance from support zone structured and directional – not a volatile spike
- RSI at 54.35 – building from the 40 floor, above midpoint, approaching the 60 threshold
- Price at 4,841.30, approaching Fibonacci 0.50 at 4,848.18
- Broader downtrend context – bounce phase within a larger corrective structure
What Does the Fibonacci 0.50 Level Represent?
The Fibonacci 0.50 retracement at 4,848.18 occupies a structurally significant position in any technical chart analysis framework. At the 50% retracement level, price is exactly halfway between the prior swing high and low – a mathematical balance point that the market frequently treats as a decision zone. Price acceptance above this level describes a market that has recovered more than half of a prior advance, which is a meaningful directional signal.
In this Gold chart analysis, the 4,848.18 level is the primary resistance test that will determine whether the current bounce phase has the momentum to extend further toward the Fibonacci 0.618 zone at 5,025.17, or whether the broader downtrend structure reasserts and produces a rejection that defines this level as the structural ceiling for the current recovery.
- Fibonacci 0.50 at 4,848.18 – the 50% midpoint of the broader corrective range
- RSI at 54.35 approaching the test – not overbought, momentum not yet fully confirmed
- Fibonacci 0.618 at 5,025.17 is the next level if the 0.50 is cleared sustainably
- A rejection here would define 4,848.18 as the current bounce ceiling
- Confluence support below at 4,671.19 and Mid Bollinger Band acts as structural floor
RSI and Bollinger Band Readings
RSI at 54.35 in this Gold educational technical chart analysis sits above the midpoint scale and below the 60 momentum confirmation threshold. The 40 level on RSI has served as the structural momentum floor throughout the bounce from the support zone, holding on multiple retests. This pattern – RSI holding the 40 floor while price advances – describes a market maintaining its recovery momentum without entering overbought territory ahead of the Fibonacci 0.50 test.
The Mid Bollinger Band, which previously acted as a resistance reference during the corrective phase, is now confirmed as support below price following the advance from the 4,671.19 confluence zone. Price trading above the Mid Bollinger Band is a Bollinger Band signal consistent with a market in a recovery phase.
Key Technical Levels for Gold (XAUUSD)
The following levels are identified in this Gold educational technical chart analysis. All levels are derived from Vipul’s expert chart analysis using publicly available market data.
Resistance Levels
| Resistance Type | Price Level | Notes |
|---|---|---|
| Immediate Resistance | 4,848.18 | Fibonacci 0.50 – primary resistance test, key decision level |
| Major Resistance | 5,025.17 | Fibonacci 0.618 – next level above if 0.50 is cleared |
Support Levels
| Support Type | Price Level | Notes |
|---|---|---|
| Confluence Support Zone | 4,650 – 4,671.19 | Fibonacci 0.382 plus Mid Bollinger Band – strong demand zone, bounce origin |
| Key Support | 4,671.19 | Fibonacci 0.382 – structural support confirmed |
| Strong Support | 4,452.20 | Fibonacci 0.236 retracement |
| Major Support | 4,098.23 | Fibonacci 0 – corrective phase base level |
Summary: Gold Technical Outlook
This Gold (XAUUSD) educational technical chart analysis for April 15, 2026 identifies a market at the doorstep of its most consequential near-term resistance test. The bounce from the 4,650 to 4,671.19 confluence support zone has been structurally sound, with RSI building from the 40 level to 54.35 and price advancing in an organised manner toward the Fibonacci 0.50 at 4,848.18.
The broader context remains a bounce phase within a downtrend. The RSI at 54.35 approaching the 0.50 test describes a market with improving but not yet fully confirmed momentum. The 40 level on RSI continues to act as the structural floor – a level that has been retested and held through the entirety of the advance from the support zone.
- Bounce phase from strong confluence support at 4,650 to 4,671.19
- RSI building from 40 floor to 54.35 – improving momentum toward key resistance test
- Fibonacci 0.50 at 4,848.18 is the primary resistance test now
- Broader downtrend context – bounce within a corrective structure, not trend reversal
- Confluence support at 4,671.19 remains the structural floor for any pullback
Want Expert Analysis on a Specific Asset?
Request a custom weekly chart interpretation of Equities, Cryptos, Commodities & Indices from Chartrick’s team of experienced technical analysts. Delivered to your inbox within 2 working days.
Decoding the Language of Charts.
Important Disclaimer
All content on Chartrick, including charts, analysis reports, articles, and educational materials, is provided for general informational and educational purposes only. Nothing on this platform constitutes investment advice, financial advice, trading advice, or any recommendation to buy, sell, or hold any financial instrument. Financial markets carry risk, and past chart analysis does not guarantee future performance. All analysis is based on publicly available market data and is subject to change at any time. While every effort is made to ensure accuracy, Chartrick does not accept liability for any loss, damage, or financial outcome arising directly or indirectly from use of or reliance on this content, including any errors or omissions in the analysis. Users are solely responsible for their own investment and trading decisions and should exercise their own independent judgment.