Silver (XAGUSD) | Published by Chartrick’s Team of Experienced Technical Analysts
Daily Analysis
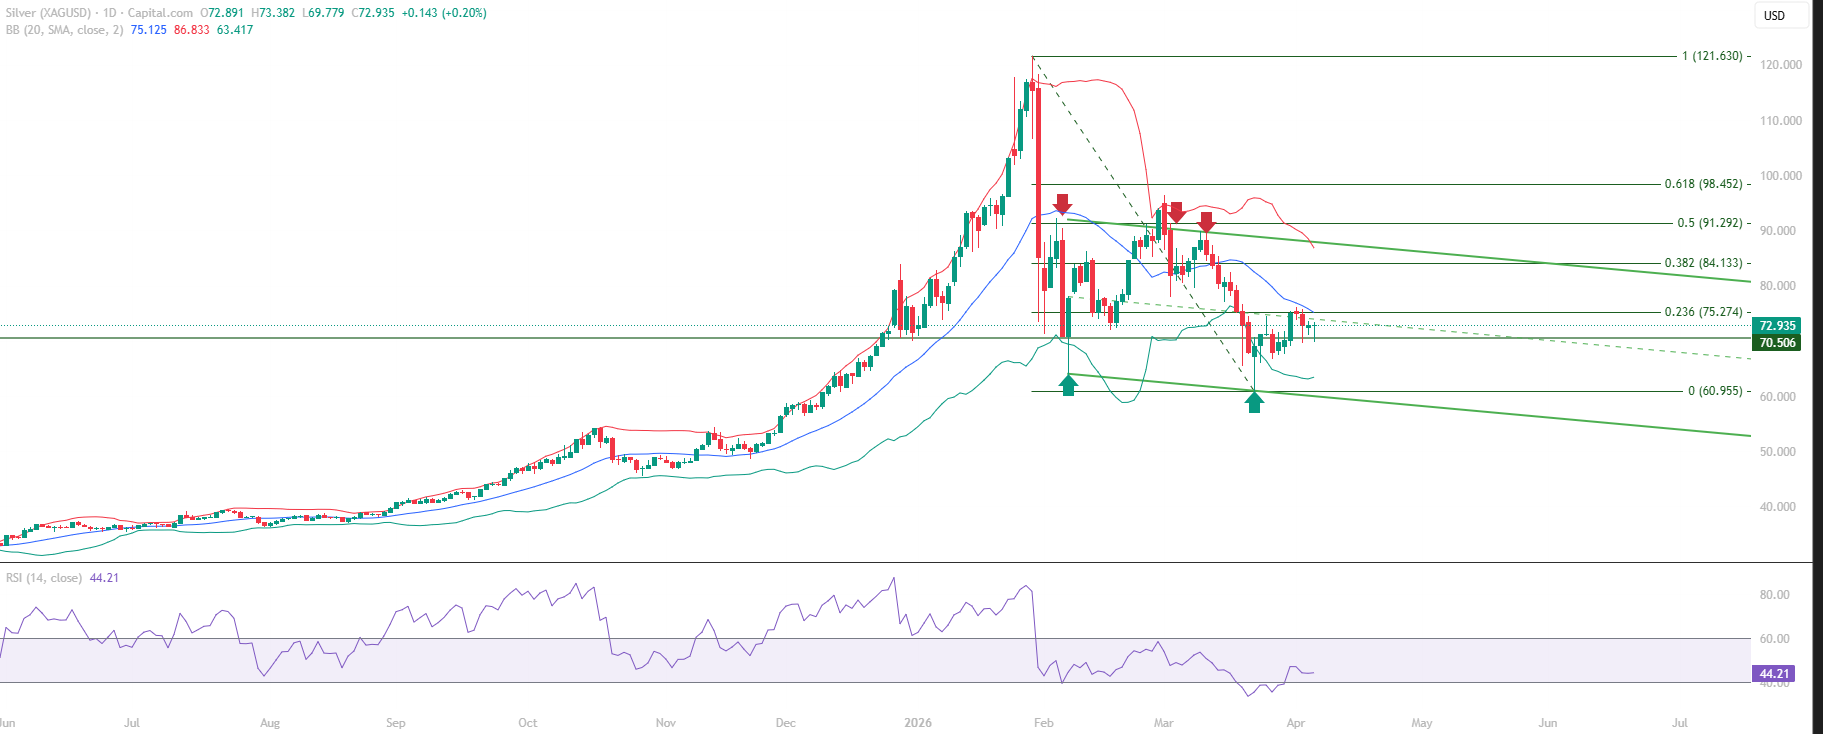
Silver (XAGUSD) educational technical chart analysis for April 8, 2026 identifies the 70.506 resistance-to-support structural transition as the defining chart development of the current phase. This level, which previously capped multiple recovery attempts as resistance, has now been overcome and is holding on retests as structural support – a polarity change that describes a genuine shift in market behaviour at this price zone.
This Silver chart analysis examines the recovery from the 60.955 base: the rally to 76.107 established the initial advance, and the subsequent retest of 70.506 confirmed the resistance-to-support transition. Price is now consolidating within the trend channel at CMP 72.935, approaching the tight resistance confluence of the Mid Bollinger Band at 75.125 and the Fibonacci 0.236 at 75.274 – two independent signals within 0.15 points of each other.
All content on this page is educational technical chart analysis provided for informational purposes only. It does not constitute investment advice or any recommendation to buy, sell, or hold any financial instrument.
What Does the 70.506 Polarity Change Establish?
In this Silver educational technical chart analysis, the polarity change at 70.506 is the most significant structural development in the current chart. A resistance level that transitions to support after being overcome carries structural memory from both directions – the market has demonstrated that buyers will defend this level, and sellers who previously used it as resistance have been displaced. This dual character makes 70.506 a structurally robust reference point.
The retest of 70.506 following the initial breakout above it confirmed the polarity change rather than just implying it. A level broken and then retested successfully describes a structural transition with confirmation – a more reliable structural signal than a level broken and not retested. This confirmation is what this Silver chart analysis identifies as the structural anchor for the current consolidation.
- 70.506 – former resistance, confirmed structural support through polarity change
- Polarity change confirmed by successful retest – not just a breakout, a tested transition
- Market memory at 70.506 from both directions strengthens structural significance
- Recovery from 60.955 to 76.107 established the advance; 70.506 retest confirmed floor
- Price consolidating at 72.935 within trend channel above the structural floor
What Is the Resistance Confluence Near 75?
The resistance zone in this Silver chart analysis sits at the convergence of the Mid Bollinger Band at 75.125 and the Fibonacci 0.236 at 75.274. The proximity of these two levels – separated by only 0.15 points – creates what this analysis describes as a tight resistance confluence. Two independent technical resistance references occupying essentially the same price zone create a concentrated overhead barrier.
The RSI 40 level is being retested as momentum support within the current structure. Holding the 40 level on this retest would confirm the momentum floor is intact, maintaining the recovery structure despite the approaching resistance zone. RSI behaviour at 40 in conjunction with price behaviour at the 75.125 to 75.274 resistance band will provide the dual signal for the next directional read.
- Mid Bollinger Band at 75.125 and Fibonacci 0.236 at 75.274 – tight confluence, 0.15 pts apart
- Two independent resistance signals at same zone create concentrated overhead barrier
- RSI 40 retest in progress – holds here confirms momentum floor for recovery structure
- Trend channel contains consolidation – structural framework intact above 70.506 floor
- 60.955 major support far below as the base of the full recovery structure
Fibonacci Framework
The Fibonacci structure in this Silver educational technical chart analysis: 0 at 60.955 (major support base), 0.236 at 75.274 (tight resistance confluence with Mid BB), 0.382 at 84.133 (strong resistance above), 0.50 at 91.292, 0.618 at 98.452. The 70.506 to 75.274 zone is the current consolidation range with the structural floor at the lower end and the resistance confluence at the upper end.
Key Technical Levels for Silver (XAGUSD)
The following levels are identified in this Silver educational technical chart analysis. All levels are derived from Vipul’s expert chart analysis using publicly available market data.
Resistance Levels
| Resistance Type | Price Level | Notes |
|---|---|---|
| Tight Confluence Resistance | 75.125 – 75.274 | Mid Bollinger Band + Fibonacci 0.236 – 0.15 pts apart, concentrated resistance zone |
| Strong Resistance | 84.133 | Fibonacci 0.382 – next significant level above the confluence zone |
| Key Resistance | 91.292 | Fibonacci 0.50 retracement |
| Major Resistance | 98.452 | Fibonacci 0.618 retracement |
Support Levels
| Support Type | Price Level | Notes |
|---|---|---|
| Key Support | 70.506 | Former resistance – confirmed structural support through polarity change and retest |
| Major Support | 60.955 | Fibonacci 0 – corrective phase base, foundation of the full recovery structure |
Summary: Silver Technical Outlook
This Silver (XAGUSD) educational technical chart analysis for April 8, 2026 identifies a market with a well-defined structural foundation at 70.506 and a well-defined resistance test approaching at the 75.125 to 75.274 confluence. The polarity change at 70.506 is confirmed through retest, and price is consolidating within the trend channel above this structural floor.
The tight resistance confluence near 75 – where the Mid Bollinger Band and Fibonacci 0.236 converge within 0.15 points – is the near-term structural test. RSI sustaining above the 40 momentum floor on the current retest maintains the recovery structure. The interaction between price and the resistance confluence, alongside the RSI 40 retest outcome, will provide the primary chart read for the period ahead.
- 70.506 polarity change confirmed through retest – structural floor firmly established
- Tight resistance confluence at 75.125 to 75.274 – Mid BB + Fibonacci 0.236
- RSI 40 retest in progress – momentum floor defence defines recovery structure integrity
- Trend channel containing price action above the 70.506 structural floor
- 60.955 major support provides the structural base for the full recovery advance
Want Expert Analysis on a Specific Asset?
Request a custom weekly chart interpretation of Equities, Cryptos, Commodities & Indices from Chartrick’s team of experienced technical analysts. Delivered to your inbox within 2 working days.
Decoding the Language of Charts.
Important Disclaimer
All content on Chartrick, including charts, analysis reports, articles, and educational materials, is provided for general informational and educational purposes only. Nothing on this platform constitutes investment advice, financial advice, trading advice, or any recommendation to buy, sell, or hold any financial instrument. Financial markets carry risk, and past chart analysis does not guarantee future performance. All analysis is based on publicly available market data and is subject to change at any time. While every effort is made to ensure accuracy, Chartrick does not accept liability for any loss, damage, or financial outcome arising directly or indirectly from use of or reliance on this content, including any errors or omissions in the analysis. Users are solely responsible for their own investment and trading decisions and should exercise their own independent judgment.