Silver (XAGUSD) | Published by Chartrick’s Team of Experienced Technical Analysts
Daily Analysis
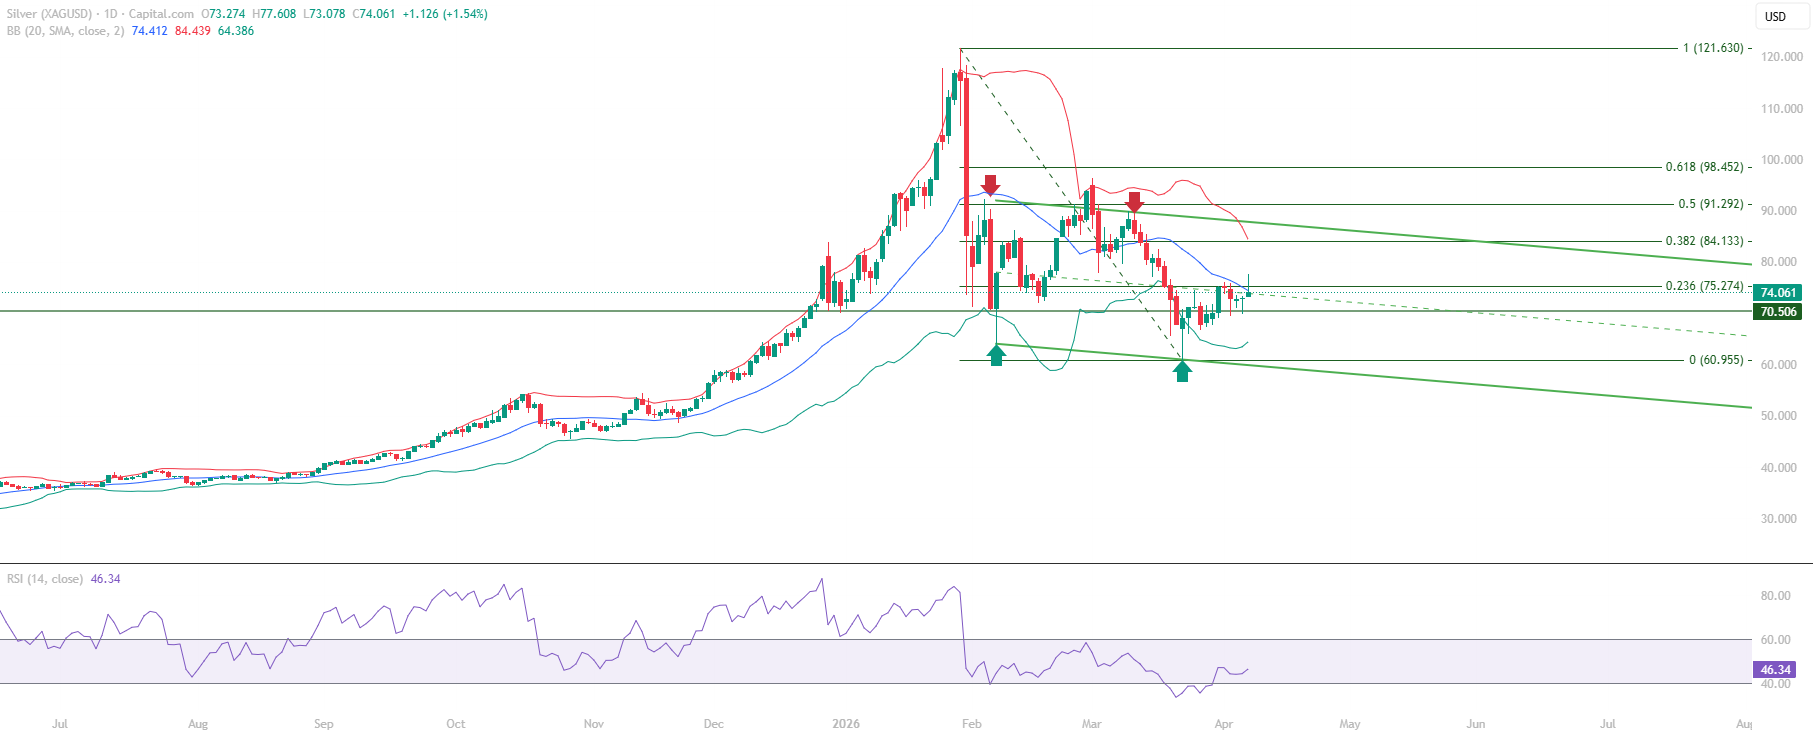
Silver (XAGUSD) educational technical chart analysis for April 9, 2026 identifies a market approaching a structurally significant compressed resistance confluence. The Mid Bollinger Band at 74.412 and the Fibonacci 0.236 at 75.274 sit within a narrow 0.86-point band above current price at 74.061 – a technically unusual compression of two independent resistance signals that will define the near-term directional read for Silver.
This Silver chart analysis examines the structural context for this resistance zone: the rally from 60.955 to 77.608 established the initial advance, with price pulling back to consolidate within the trend channel after rejection near the Fibonacci 0.236. The 70.506 resistance-to-support transition continues to anchor the structural floor, holding on multiple retests and defining the lower boundary of the current consolidation range.
All content on this page is educational technical chart analysis provided for informational purposes only. It does not constitute investment advice or any recommendation to buy, sell, or hold any financial instrument.
What Is the Significance of the Compressed Resistance Zone?
In this Silver educational technical chart analysis, the compression of the Mid Bollinger Band at 74.412 and the Fibonacci 0.236 at 75.274 into a less-than-one-point band is a structurally notable configuration. Two independent technical resistance signals – one dynamic (Bollinger Band) and one fixed (Fibonacci retracement) – aligning within the same narrow zone creates what this chart analysis describes as a compressed resistance confluence.
The significance of this compression is that it concentrates resistance. Price approaching a zone with two distinct technical reasons to stall has a structurally different character than approaching a single isolated resistance level. A break above the full 74.4 to 75.3 zone with follow-through would represent a more meaningful structural signal than clearing a single level. A rejection from within the zone would confirm both signals as active resistance simultaneously.
- Mid Bollinger Band at 74.412 – dynamic resistance, first boundary of compressed zone
- Fibonacci 0.236 at 75.274 – fixed resistance, upper boundary of compressed zone
- Compression of both signals within 0.86 points – concentrated resistance confluence
- CMP at 74.061 – approaching the lower edge of the compressed resistance band
- 70.506 resistance-to-support transition holding as structural floor below
What Does the 70.506 Structural Floor Tell Us?
The 70.506 level in this Silver chart analysis is the defining structural development of the current consolidation phase. A former resistance zone that capped multiple prior recovery attempts has been overcome and is now holding as support on retests – a polarity change that describes a genuine shift in market behaviour at this price level. The repeated testing and defending of 70.506 as support adds structural credibility to this level as the consolidation floor.
Price consolidating between the 70.506 structural floor and the 74.412 to 75.274 compressed resistance band above describes a market compressing between two well-defined technical boundaries. This compression structure will eventually resolve directionally, and the resolution will be defined by how price interacts with the compressed resistance zone overhead.
- 70.506 – former resistance now confirmed structural support through multiple retests
- Polarity change at 70.506 describes genuine market behaviour shift at this level
- Consolidation range: 70.506 floor below, 74.412 to 75.274 resistance band above
- RSI sustaining above 40 – momentum floor intact within the consolidation range
- Trend channel containing consolidation provides additional structural reference
Key Technical Levels for Silver (XAGUSD)
The following levels are identified in this Silver educational technical chart analysis. All levels are derived from Vipul’s expert chart analysis using publicly available market data.
Resistance Levels
| Resistance Type | Price Level | Notes |
|---|---|---|
| Compressed Resistance Zone | 74.412 – 75.274 | Mid Bollinger Band + Fibonacci 0.236 – dual confluence within narrow band |
| Strong Resistance | 84.133 | Fibonacci 0.382 – next significant level above the compressed zone |
| Key Resistance | 91.292 | Fibonacci 0.50 retracement |
| Major Resistance | 98.452 | Fibonacci 0.618 retracement |
Support Levels
| Support Type | Price Level | Notes |
|---|---|---|
| Key Support | 70.506 | Former resistance, confirmed structural support – multiple retests held |
| Major Support | 60.955 | Fibonacci 0 – corrective phase base, major structural floor |
Summary: Silver Technical Outlook
This Silver (XAGUSD) educational technical chart analysis for April 9, 2026 identifies a market in consolidation approaching a structurally notable compressed resistance confluence. The 70.506 structural floor is confirmed and holding, RSI is sustaining above the 40 momentum floor, and price is consolidating within the trend channel between these structural boundaries.
The near-term structural question is whether Silver can push through the 74.412 to 75.274 compressed resistance band. A break above the full zone with RSI follow-through would represent a meaningful structural development within the recovery structure. A rejection from within the zone would confirm both signals as active resistance and maintain the current consolidation range boundaries.
- Compressed resistance confluence at 74.412 to 75.274 – dual signals within narrow band
- 70.506 structural floor confirmed through multiple retests – consolidation base intact
- RSI sustaining above 40 – momentum floor held throughout consolidation phase
- Trend channel containing price action – structural framework intact
- Consolidation range: 70.506 floor to 74.412-75.274 resistance band
Want Expert Analysis on a Specific Asset?
Request a custom weekly chart interpretation of Equities, Cryptos, Commodities & Indices from Chartrick’s team of experienced technical analysts. Delivered to your inbox within 2 working days.
Decoding the Language of Charts.
Important Disclaimer
All content on Chartrick, including charts, analysis reports, articles, and educational materials, is provided for general informational and educational purposes only. Nothing on this platform constitutes investment advice, financial advice, trading advice, or any recommendation to buy, sell, or hold any financial instrument. Financial markets carry risk, and past chart analysis does not guarantee future performance. All analysis is based on publicly available market data and is subject to change at any time. While every effort is made to ensure accuracy, Chartrick does not accept liability for any loss, damage, or financial outcome arising directly or indirectly from use of or reliance on this content, including any errors or omissions in the analysis. Users are solely responsible for their own investment and trading decisions and should exercise their own independent judgment.