S&P 500 (SPX) | Published by Chartrick’s Team of Experienced Technical Analysts
Weekly Analysis
April 14 – 18, 2026
6,816.89 (as on 10 Apr 2026)
Recovery / Strong Momentum Within Broader Uptrend – Confluence Resistance Test
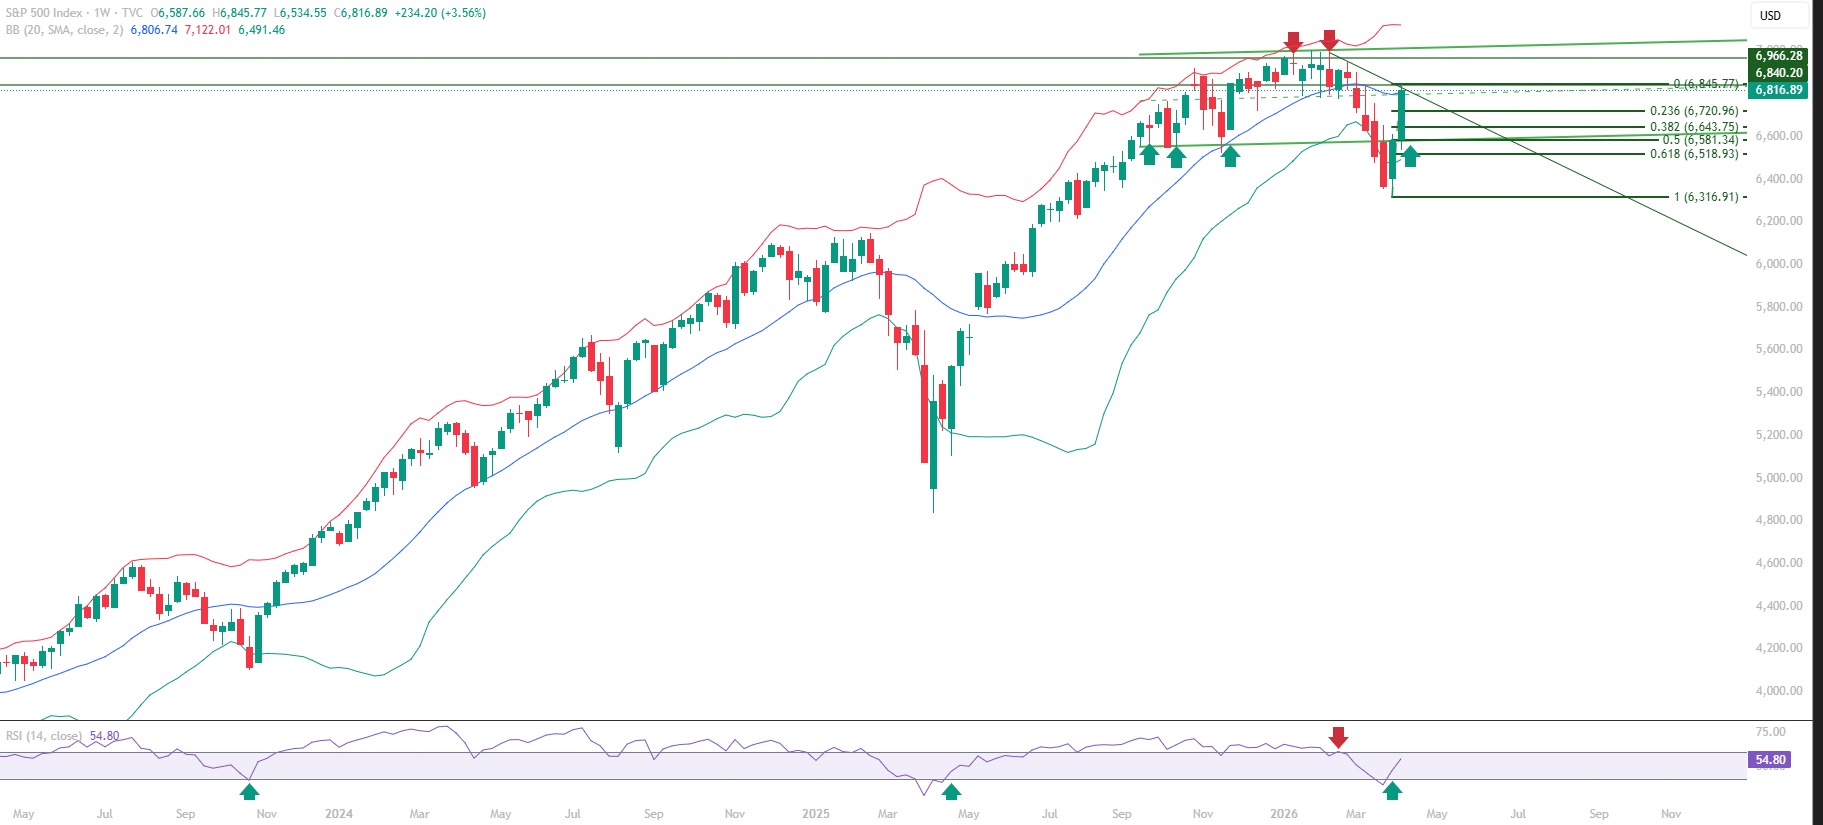
S&P 500 weekly educational technical chart analysis for the week of April 14-18, 2026 identifies a market at a decisive structural crossroads. Price has staged a sharp recovery from the 6,316.91 low, reclaiming the trend channel and closing near the 6,816.89 level. The critical structural development for the week ahead is the confluence of the Mid Bollinger Band at 6,806.74 and the downward sloping trendline sitting directly overhead – a dual resistance zone that will determine whether the recovery phase extends further or encounters a meaningful structural test.
This S&P 500 chart analysis examines the quality of the recovery and the significance of the resistance zone ahead. RSI has reclaimed the 40 level and is approaching the 60 threshold – the momentum confirmation level that separates a corrective bounce from a trend-resumption advance. The Fibonacci retracement framework maps the recovery range clearly, with the 0.236 level at 6,720.96 now acting as the key structural support beneath current price.
All content on this page is educational technical chart analysis provided for informational purposes only. It does not constitute investment advice or any recommendation to buy, sell, or hold any financial instrument.
What Does the Trend Channel Reclaim Mean Structurally?
In this S&P 500 educational technical chart analysis, the reclaim of the trend channel is the primary structural development from the prior week. The trend channel defines the boundaries of the broader uptrend structure – price returning to within the channel after a corrective move that briefly broke below it is a technically meaningful development. It describes a market where the corrective pressure has been absorbed and the broader structural framework is reasserting.
The recovery from 6,316.91 to 6,845.77 in the preceding sessions established buying pressure at lower levels, with accumulation behaviour visible through the Fibonacci retracement structure. Each Fibonacci level cleared during the advance adds structural weight to the recovery. The market now sits near the 6,840.20 immediate resistance zone, with the trend channel reclaim providing the structural context for the week’s test.
- Trend channel reclaimed – broader uptrend framework reasserting after corrective break
- Recovery from 6,316.91 to 6,845.77 – accumulation behaviour at lower Fibonacci levels
- Immediate resistance at 6,840.20 – the level price is pressing against into the week
- Mid Bollinger Band at 6,806.74 acting as near-term support below current price
- RSI reclaimed the 40 level – key momentum floor restored after corrective phase
What Is the Confluence Resistance Zone for the Week?
This S&P 500 educational technical chart analysis identifies the confluence of the Mid Bollinger Band and the downward sloping trendline as the primary structural test zone for the week of April 14-18. The Mid Bollinger Band represents a dynamic resistance reference that price must sustain above to confirm a momentum-backed advance. The downward sloping trendline connects the lower highs of the corrective phase and sits directly overhead – a trendline that, if broken with a confirmed close above, would remove the structural ceiling of the corrective phase entirely.
The significance of a dual confluence resistance zone is that two independent technical signals are aligned at the same price zone. A rejection from the confluence would provide a strong structural signal that the corrective phase ceiling remains intact. A sustained break above it, confirmed by RSI crossing the 60 level, would represent a meaningful structural upgrade for the week’s outcome.
- Mid Bollinger Band at 6,806.74 – dynamic resistance reference, price must sustain above
- Downward sloping trendline – structural ceiling of corrective phase, directly overhead
- Dual confluence: both signals at the same zone creates a high-significance resistance test
- A confirmed break above the trendline would remove the corrective ceiling entirely
- RSI approaching 60 – the momentum confirmation level for the resolution of this test
RSI Momentum Structure
RSI analysis in this S&P 500 weekly educational technical chart analysis shows the momentum indicator rebuilding from the 40 level. The 40 level has acted as a strong momentum base on the weekly timeframe, with multiple retests held during the corrective phase. RSI now approaching the 60 level describes improving momentum structure, but the 60 threshold itself represents the confirmation point – sustaining above it in conjunction with a price break above the trendline resistance would be the technical signal that describes trend resumption rather than a corrective bounce.
What Does the Fibonacci Framework Show?
The Fibonacci retracement structure in this S&P 500 chart analysis maps the recovery range from the corrective low at 6,316.91 to the recent high at 6,845.77. The 0.236 level at 6,720.96 is the key structural support for the week – a level that defines the boundary between the current recovery structure and a deeper corrective retest. The 0.382 at 6,643.75 and the 0.50 at 6,581.34 provide deeper support context below.
- Fibonacci 0 at 6,316.91 – corrective phase low, base of the recovery structure
- Fibonacci 0.236 at 6,720.96 – key structural support for the week, primary floor
- Fibonacci 0.382 at 6,643.75 – secondary support below the key level
- Fibonacci 0.50 at 6,581.34 – major support if deeper corrective retest develops
- Fibonacci 0 at 6,845.77 – recent high, aligns with 6,840.20 immediate resistance
Key Technical Levels for S&P 500 (SPX)
The following levels are identified in this S&P 500 educational technical chart analysis. All levels are derived from Vipul’s expert chart analysis using publicly available market data.
Resistance Levels
| Resistance Type | Price Level | Notes |
|---|---|---|
| Immediate Resistance | 6,840.20 | Primary resistance zone – price pressing against this level into the week |
| Confluence Resistance Zone | Mid BB + Trendline | Mid Bollinger Band at 6,806.74 + downward sloping trendline – dual confluence overhead |
Support Levels
| Support Type | Price Level | Notes |
|---|---|---|
| Immediate Support | 6,806.74 | Mid Bollinger Band – near-term dynamic support below current price |
| Key Support | 6,720.96 | Fibonacci 0.236 – primary structural support floor for the week |
| Major Support | 6,643.75 | Fibonacci 0.382 – secondary support below the key level |
| Strong Support | 6,581.34 | Fibonacci 0.50 – major support for deeper corrective retest scenario |
| Structural Base | 6,316.91 | Fibonacci 0 – corrective phase low, base of recovery structure |
Summary: S&P 500 Technical Outlook for the Week
This S&P 500 weekly educational technical chart analysis for the week of April 14-18, 2026 identifies a market that has reclaimed the trend channel and is approaching a decisive dual confluence resistance test. The quality of the recovery from 6,316.91 is structurally sound – accumulation behaviour at lower Fibonacci levels, RSI reclaiming and holding the 40 momentum floor, and price returning to within the trend channel framework.
The week’s primary technical event is the interaction between price and the Mid Bollinger Band / downward sloping trendline confluence overhead. A sustained break and close above this dual resistance zone, confirmed by RSI crossing the 60 level, would represent a meaningful structural development. A rejection from the confluence would confirm the corrective ceiling remains intact and define 6,840.20 as the current recovery high. The 6,720.96 Fibonacci 0.236 level is the key structural support to monitor on any pullback during the week.
- Trend channel reclaimed – broader uptrend framework reasserting structurally
- Dual confluence resistance: Mid Bollinger Band + downward sloping trendline overhead
- RSI approaching 60 from the confirmed 40 floor – momentum rebuilding
- Fibonacci 0.236 at 6,720.96 is the primary structural support floor for the week
- Week outcome at the confluence zone will define the next phase of S&P 500 structure
Want Expert Analysis on a Specific Asset?
Request a custom weekly chart interpretation of Equities, Cryptos, Commodities & Indices from Chartrick’s team of experienced technical analysts. Delivered to your inbox within 2 working days.
Decoding the Language of Charts.
Important Disclaimer
All content on Chartrick, including charts, analysis reports, articles, and educational materials, is provided for general informational and educational purposes only. Nothing on this platform constitutes investment advice, financial advice, trading advice, or any recommendation to buy, sell, or hold any financial instrument. Financial markets carry risk, and past chart analysis does not guarantee future performance. All analysis is based on publicly available market data and is subject to change at any time. While every effort is made to ensure accuracy, Chartrick does not accept liability for any loss, damage, or financial outcome arising directly or indirectly from use of or reliance on this content, including any errors or omissions in the analysis. Users are solely responsible for their own investment and trading decisions and should exercise their own independent judgment.