S&P 500 (SPX) | Published by Chartrick’s Team of Experienced Technical Analysts
Daily Analysis
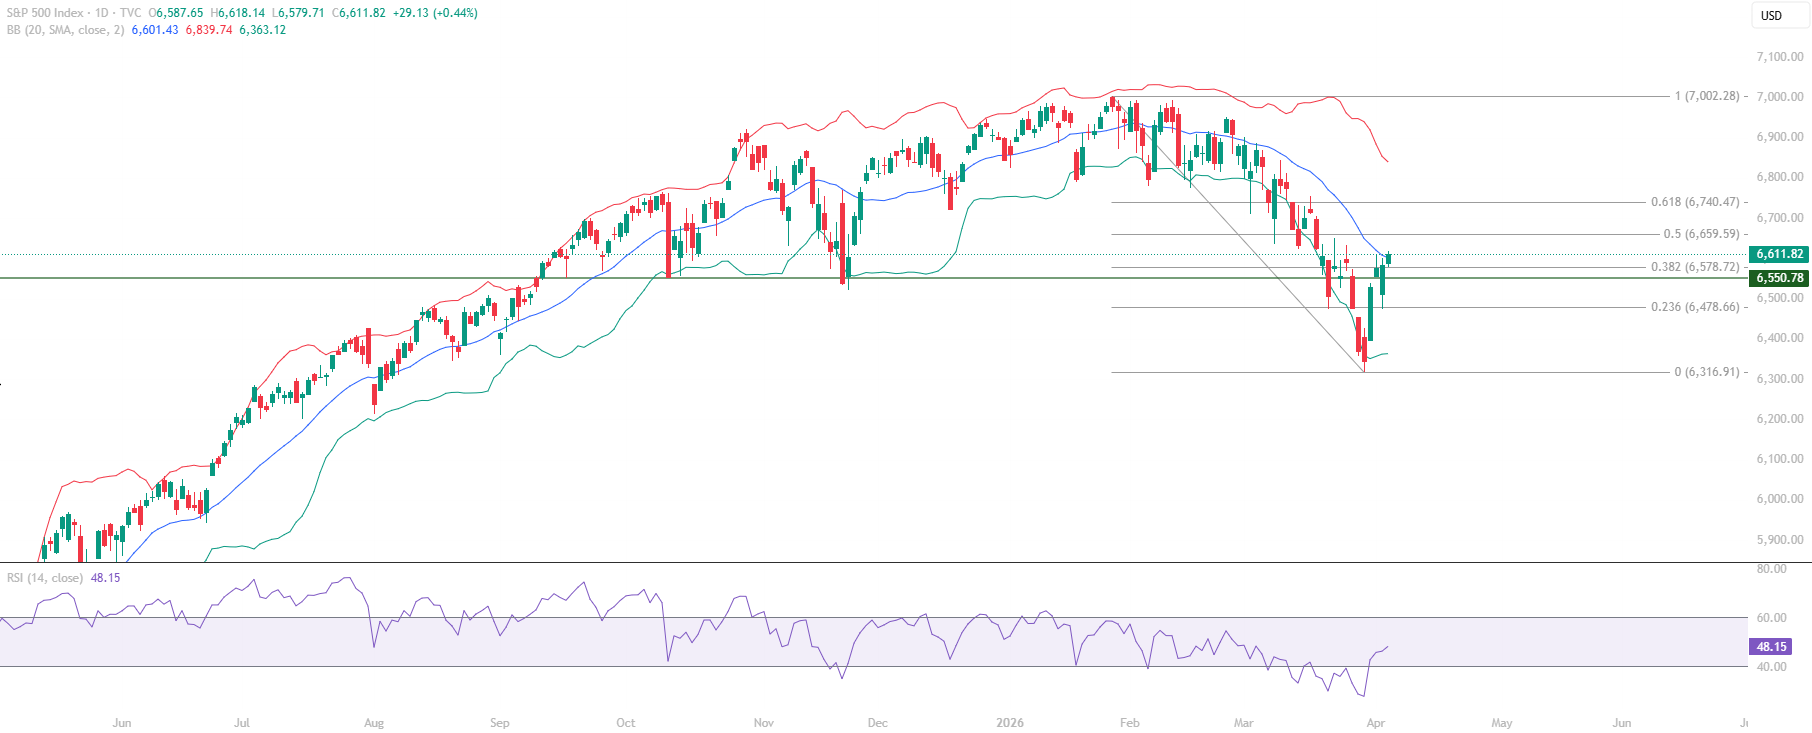
S&P 500 educational technical chart analysis for April 7, 2026 identifies a sharp recovery from the Fibonacci 0.236 support at 6,478.66, with price rallying to 6,618.14 and closing marginally above the Mid Bollinger Band at 6,601.43. RSI simultaneously retested the 40 level and is holding – a confluence of two independent structural signals at the same time that this chart analysis identifies as technically significant.
This S&P 500 chart analysis examines the structural significance of the 6,550.78 reclaim. This level had previously defended as strong support on multiple occasions, and its reclaim during the current bounce describes a market where buyers are returning to a structurally recognised price zone. The Fibonacci 0.382 at 6,578.72, 0.50 at 6,659.59, and 0.618 at 6,740.47 frame the resistance structure above.
All content on this page is educational technical chart analysis provided for informational purposes only. It does not constitute investment advice or any recommendation to buy, sell, or hold any financial instrument.
What Is the RSI 40 and Mid Bollinger Band Confluence?
In this S&P 500 educational technical chart analysis, the simultaneous testing of RSI 40 and the price interaction with the Mid Bollinger Band at 6,601.43 is a confluent structural event. RSI at the 40 level describes a momentum test – a level that has acted as a momentum pivot across the corrective phase, where holding above describes bullish momentum retention and breaking below signals weakening trend strength. The Mid Bollinger Band at the same time describes a dynamic structural reference for price.
Both signals holding simultaneously is the technical observation this analysis focuses on. It describes a market where momentum support and price structure support are reinforcing each other at the same time, rather than diverging. The 6,478.66 Fibonacci 0.236 below provided the price floor, and the RSI 40 provided the momentum floor – both tested together and both holding together.
- Fibonacci 0.236 at 6,478.66 – price floor retested and held, structural support confirmed
- RSI 40 retested and holding – momentum floor confirmed simultaneously with price
- Mid Bollinger Band at 6,601.43 reclaimed – marginal close above, transitioning to support
- 6,550.78 reclaimed – multi-test support level, now acting as structural floor
- 6,659.59 Fibonacci 0.50 is the primary resistance test ahead
What Does the 6,550.78 Reclaim Tell Us?
The 6,550.78 level in this S&P 500 chart analysis carries structural weight from prior sessions. A level that has defended as strong support on multiple prior occasions has been retested during the current corrective phase and is now being reclaimed. The market’s return above this level during the bounce describes it as a recognised structural reference with established buyer memory behind it.
The 6,550.78 to 6,659.59 zone is described as the critical reaction range in this analysis – strong structural support at the lower end and the Fibonacci 0.50 resistance at the upper end. Price behaviour within this zone, in conjunction with RSI sustaining above 40, will determine whether the recovery extends toward the 0.618 at 6,740.47 or produces another support retest below.
- 6,550.78 – multi-test structural support reclaimed during bounce
- Critical zone: 6,550.78 to 6,659.59 with support below and Fibonacci 0.50 above
- Fibonacci 0.618 at 6,740.47 is the next structural milestone above the critical zone
- Mid Bollinger Band at 6,601.43 – dynamic support reference within the critical zone
- Broader long-term uptrend intact – recovery occurring within continuing uptrend context
Key Technical Levels for S&P 500 (SPX)
The following levels are identified in this S&P 500 educational technical chart analysis. All levels are derived from Vipul’s expert chart analysis using publicly available market data.
Resistance Levels
| Resistance Type | Price Level | Notes |
|---|---|---|
| Key Resistance | 6,659.59 | Fibonacci 0.50 – primary resistance test for recovery phase |
| Major Resistance | 6,740.47 | Fibonacci 0.618 – next significant level above |
Support Levels
| Support Type | Price Level | Notes |
|---|---|---|
| Immediate Support | 6,601.43 | Mid Bollinger Band – reclaimed, transitioning to structural support |
| Key Support | 6,578.72 | Fibonacci 0.382 – structural support |
| Major Support | 6,550.78 | Multi-test structural support – reclaimed during bounce |
| Strong Support | 6,478.66 | Fibonacci 0.236 – held on retest, price floor confirmed |
| Structural Base | 6,316.91 | Fibonacci 0 – corrective phase low |
Summary: S&P 500 Technical Outlook
This S&P 500 educational technical chart analysis for April 7, 2026 identifies a technically meaningful confluence: RSI 40 and the Fibonacci 0.236 floor held simultaneously, with price reclaiming the Mid Bollinger Band and the multi-test 6,550.78 support level in a single recovery move. The structural foundation of the bounce is sound.
The critical zone of 6,550.78 to 6,659.59 is now the primary structural range to monitor. RSI sustaining above 40 maintains the recovery structure. The Fibonacci 0.50 at 6,659.59 is the resistance test that will define whether the current recovery phase extends further or pauses for consolidation. The broader uptrend on the long-term timeframe remains intact.
- RSI 40 and Fibonacci 0.236 held simultaneously – confluent structural support confirmed
- Mid Bollinger Band at 6,601.43 reclaimed – transitioning to structural support
- 6,550.78 multi-test support reclaimed – structural floor re-established
- Fibonacci 0.50 at 6,659.59 is the primary resistance test for the recovery
- Broader long-term uptrend intact – corrective phase within continuing uptrend context
Want Expert Analysis on a Specific Asset?
Request a custom weekly chart interpretation of Equities, Cryptos, Commodities & Indices from Chartrick’s team of experienced technical analysts. Delivered to your inbox within 2 working days.
Decoding the Language of Charts.
Important Disclaimer
All content on Chartrick, including charts, analysis reports, articles, and educational materials, is provided for general informational and educational purposes only. Nothing on this platform constitutes investment advice, financial advice, trading advice, or any recommendation to buy, sell, or hold any financial instrument. Financial markets carry risk, and past chart analysis does not guarantee future performance. All analysis is based on publicly available market data and is subject to change at any time. While every effort is made to ensure accuracy, Chartrick does not accept liability for any loss, damage, or financial outcome arising directly or indirectly from use of or reliance on this content, including any errors or omissions in the analysis. Users are solely responsible for their own investment and trading decisions and should exercise their own independent judgment.